


 23 July 2013
2013- n° 173Demand adressed to business leaders increases in Q2 2013 Quarterly business survey (goods-producing industries) - July 2013
23 July 2013
2013- n° 173Demand adressed to business leaders increases in Q2 2013 Quarterly business survey (goods-producing industries) - July 2013
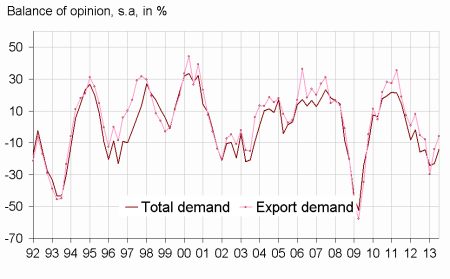
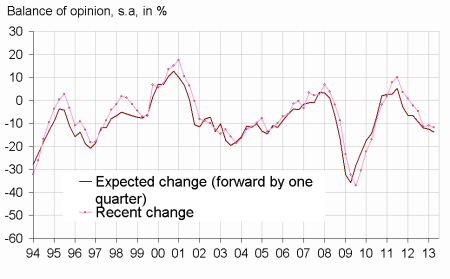
In Q2 2013, the global and export demand adressed to business leaders increased but remain still weak. For Q3 2013, the global and export demand outlook would be slightly more favorable but the corresponding balances are remain below their long-term average .
Manufacturing industry
In Q2 2013, the global and export demand adressed to business leaders increased but remain still weak. For Q3 2013, the global and export demand outlook would be slightly more favorable but the corresponding balances are remain below their long-term average .
Production capacity was used so in Q2 2013 than in Q1 2013: the productive capacity utilisation rate remains markedly bellow its long-term average. Nevertheless the proportion of businesses encountering production bottlenecks decreased and reached its long-term average.
According to the business leaders, the decrease in industrial manpower stabilizes in Q2 2013 so in Q3 2013: the corresponding balances of opinion are near their average level.
tableautableau – Business leaders' opinion : Demand and production factors
| Manufacturing industry | MOY* | Oct. 12 | Jan. 13 | April 13 | July 13 |
|---|---|---|---|---|---|
| Total demand | |||||
| Recent changes | 0 | –14 | –24 | –23 | –14 |
| Expected change | 1 | –7 | –9 | –4 | –5 |
| Export demand | |||||
| Recent changes | 3 | –8 | –30 | –14 | –6 |
| Expected change | 4 | –6 | –14 | 2 | –1 |
| Production factors | |||||
| Share of firms producing at full capacity (in%) | 22 | 21 | 27 | 25 | 24 |
| Opinion on production capacity | 14 | 17 | 23 | 23 | 14 |
| Productive capacity utilization rate (in %) | 85 | 80 | 81 | 80 | 80 |
| Difficulties of supply and demand | |||||
| Difficulties of supply and demand | 8 | 11 | 8 | 12 | 12 |
| Difficulties of supply | 21 | 14 | 19 | 18 | 14 |
| Difficulties of demand | 44 | 50 | 57 | 47 | 50 |
- * : Long period average.
- Source : Quarterly business survey - INSEE
graphiqueGraph1ang – Recent changes in demand
graphiqueGraph3ang – Workforce in manufacturing industry
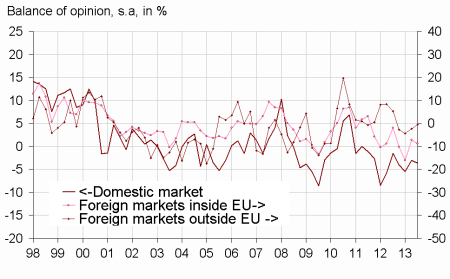
graphiqueGraph4ang – Competitive position
Documentation
Methodology (pdf,48 Ko)
Pour en savoir plus
Time series : Industry
