


 23 January 2014
2014- n° 19In January 2014, the business climate is getting better in the retail trade and
in the trade and repair of motor vehicles Monthly survey of retailing - January 2014
23 January 2014
2014- n° 19In January 2014, the business climate is getting better in the retail trade and
in the trade and repair of motor vehicles Monthly survey of retailing - January 2014
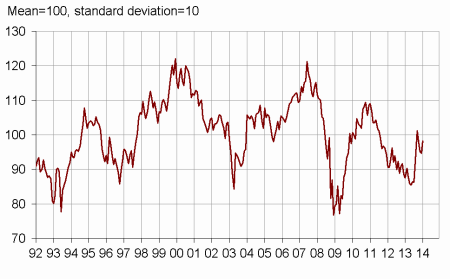
According to the managers surveyed in January 2014, the business climate is getting better in the retail trade and in the trade and repair of motor vehicles: the composite indicator went up again, but still remained under its long-term average.
According to the managers surveyed in January 2014, the business climate is getting better in the retail trade and in the trade and repair of motor vehicles: the composite indicator went up again, but still remained under its long-term average.
graphiquegraph_indsynt_en – Business climate synthetic indicator
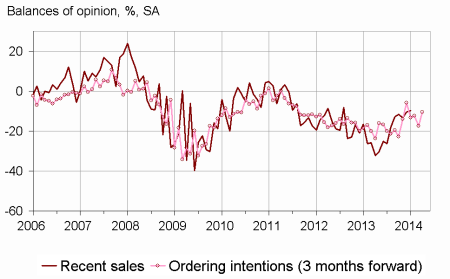
The general business outlook increases
As many managers than in December have declared a decrease in their past activity, but the corresponding balance has been only just under its mean level. This steadiness has been noted in both retail trade and motor vehicles. About forecasts, the balances concerning expected sales and ordering intentions have got back to their October and November levels, lower than their mean level. However, general business outlook have risen again, sign that the retailers might be less pessimistic about the economic situation in the trade sector.
The balance concerning past prices has gone down¸ but the one that concerns expected prices has stabilized.
The cash flow is estimated slightly less difficult.
graphiqueGraph_ventes_ic_en – Recent sales and ordering intentions
tableautab1_en – Global data
| Ave. (1) | Oct. 13 | Nov. 13 | Dec. 13 | Jan. 14 | |
|---|---|---|---|---|---|
| Business climate | 100 | 98 | 95 | 95 | 98 |
| General business outlook | –30 | –29 | –37 | –35 | –33 |
| Recent sales | –7 | –12 | –13 | –10 | –10 |
| Expected sales | –3 | –10 | –10 | –3 | –9 |
| Ordering intentions | –9 | –13 | –12 | –17 | –11 |
| Stocks | 11 | 10 | 9 | 11 | 12 |
| Past selling prices (2) | –6 | –6 | –13 | ||
| Expected selling prices | –2 | –5 | –4 | 1 | 1 |
| Cash position (2) | –15 | –25 | –23 | ||
| Workforce size: recent trend | 0 | –8 | –9 | –3 | –4 |
| Workforce size: future trend | –2 | –5 | –10 | –6 | –7 |
- (1) Average since 1991 (2004 for recent and expected sales and ordering intentions).
- (2) Bi-monthly question (odd-numbered months).
- Source: monthly survey in the retail trade and in the trade and repair of motor vehicles - INSEE
Steadiness of job losses
According to business managers, job losses pace has stabilized over the last and the next few months. Each of the two balances has stayed under its average.
Retail trade
Steadiness of past activity
As many retailers than over the last month have declared a fall in their past sales, in both non-specialized and specialized trade. Each of the corresponding balances has remained only slightly under its mean level. About forecasts, the expected sales balance has significantly declined, getting under its average, while the ordering intentions one has increased.
Stocks were still estimated higher than their standard level.
Compare to the previous surveys, more retailers have declared a fall in both past and expected prices.
The cash flow situation is estimated slightly less difficult.
Trade and repair of motor vehicles
graphiquegraph_ventes_ic_auto_en – Recent sales and ordering intentions in motor vehicles
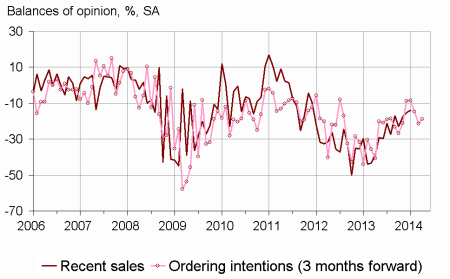
Grim past and previous activities
According to vehicle traders, past activity has remained rather grim, the balance still being under its mean level. Expected sales and ordering intentions have slightly risen, each of both balances remaining under its average.
The level of stocks has been considered stable for three months in a row, still under the standard level.
The balance concerning past selling prices decreases. The one that concerns expected prices is stable at its mean level.
The cash flow position is still estimated as rather difficult.
tableautab2_en – Detailed data
| Moy. (1) | Oct. 13 | Nov. 13 | Dec. 13 | Jan. 14 | |
|---|---|---|---|---|---|
| Retail trade - Global data | |||||
| Recent sales | –5 | –7 | –12 | –8 | –9 |
| Expected sales | 0 | –9 | –11 | 6 | –9 |
| Ordering intentions | –7 | –15 | –12 | –17 | –11 |
| Stocks | 10 | 11 | 9 | 13 | 14 |
| Past selling prices (2) | –8 | –7 | –15 | ||
| Expected selling prices | –4 | –4 | –5 | –2 | –5 |
| Cash position (2) | –13 | –23 | –20 | ||
| Workforce size: recent trend | 1 | –4 | –7 | –1 | 0 |
| Workforce size: future trend | –2 | –4 | –10 | –4 | –4 |
| Non-specialized retail trade | |||||
| Recent sales | –1 | 5 | –7 | –5 | –6 |
| Expected sales | 6 | 4 | 1 | 18 | –11 |
| Ordering intentions | 2 | –5 | 0 | –13 | –7 |
| Stocks | 7 | 10 | 5 | 13 | 18 |
| Past selling prices (2) | –7 | –2 | –17 | ||
| Expected selling prices | –4 | 2 | –4 | 1 | –7 |
| Cash position (2) | –7 | –12 | –10 | ||
| Specialized retail trade | |||||
| Recent sales | –9 | –21 | –17 | –12 | –12 |
| Expected sales | –7 | –19 | –20 | –5 | –17 |
| Ordering intentions | –17 | –20 | –20 | –22 | –25 |
| Stocks | 14 | 12 | 14 | 14 | 9 |
| Past selling prices (2) | –8 | –12 | –12 | ||
| Expected selling prices | –4 | –12 | –7 | –6 | –3 |
| Cash position (2) | –22 | –36 | –31 | ||
| Trade and repair of motor cars and motorcycles | |||||
| Recent sales | –11 | –23 | –17 | –15 | –14 |
| Expected sales | –9 | –10 | –11 | –19 | –14 |
| Ordering intentions | –14 | –8 | –15 | –22 | –19 |
| Stocks | 15 | 7 | 6 | 7 | 7 |
| Past selling prices (2) | 1 | –6 | –9 | ||
| Expected selling prices | 5 | 0 | 2 | 5 | 4 |
| Cash position (2) | –26 | –30 | –31 | ||
| Workforce size: recent trend | –9 | –24 | –20 | –16 | –18 |
| Workforce size: future trend | –8 | –12 | –15 | –15 | –17 |
- (1) Average since 1991 (2003 for trade and repair of motor vehicles and 2004 for recent and expected sales and ordering intentions).
- (2) Bi-monthly question (odd-numbered months).
- Source: monthly survey in the retail trade and in the trade and repair of motor vehicles - INSEE
Documentation
Methodology (pdf,129 Ko)
Pour en savoir plus
