


 13 September 2013
2013- n° 210Decrease in business start-ups in August 2013 Enterprise births - August 2013
13 September 2013
2013- n° 210Decrease in business start-ups in August 2013 Enterprise births - August 2013
In August 2013, the number of business start-ups decreased compared to July: -11.4% for business setting up (seasonally and working-day adjusted data) including self-managed enterprises. This fall is slightly compensated by the start-ups excluding self-managed enterprises (+0.8% seasonally and working-day adjusted data).
Warning : Only business start-ups data excluding self-managed enterprises (SME) are seasonally adjusted. In order to get the total number of enterprise creation, the raw number of SME is added. The SME time series is too short to be properly deseasonalized; those data will be seasonally adjusted in the next and subsequent issues.
In August 2013, the number of business start-ups decreased compared to July: -11.4% for business setting up (seasonally and working-day adjusted data) including self-managed enterprises. This fall is slightly compensated by the start-ups excluding self-managed enterprises (+0.8% seasonally and working-day adjusted data).
-6.2% year-on-year (quarterly basis)
The amount of entries added up in the last quarter decreased compared to the same quarter one year before (-6.2%).
The sectors that most contributed to that decrease were construction, household services and business support activities.
-4.2% year-on-year (twelve months basis)
During the last twelve months, the number of business start-ups decreased by 4.2% year-on-year.
181,648 self-managed enterprises since the beginning of 2013
For the first eight months of 2013, more than one out of two businesses set up were self-managed enterprises (181,648).
tableautab0 – Self-managed business set-ups
| May 2013 | June 2013 | July 2013 | Aug. 2013 |
|---|---|---|---|
| 22 291 | 21 937 | 21 446 | 16 331 |
- Source: INSEE (Sirene)
tableautab1EN – Business set-ups by month
| May 2013 | June 2013 | July 2013 | Aug. 2013 | |
|---|---|---|---|---|
| Excl. self-managed enterprises (sa-wda *) | 22 577 | 21 908 | 21 742 | 21 920 |
| Variation [m-o-m] % | 4.5 | -3.0 | -0.8 | 0.8 |
| Incl., in raw data, self-managed enterprises | 44 868 | 43 845 | 43 188 | 38 251 |
| Variation [m-o-m] % | -2.6 | -2.3 | -1.5 | -11.4 |
- * Seasonally and working-day adjusted data
- Source: INSEE (Sirene)
tableautab2EN – business start-ups by type
| Moving total % change* | Moving total | Moving total | ||
|---|---|---|---|---|
| over 3 months | over 12 months | January- August 2013 | January- August 2012 | |
| Total | -6.2 | -4.2 | 358 321 | 373 332 |
| Companies | -2.4 | -3.9 | 106 493 | 108 730 |
| Individual enterprises | -7.8 | -4.4 | 251 828 | 264 602 |
| Of which self-managed | -16.7 | -9.1 | 181 648 | 208 017 |
- * Total of business start-ups during the last 3 or 12 months compared with the same months a year earlier
- // = meaningless
- Source: INSEE (Sirene)
graphiqueGraph1EN – Business start-ups
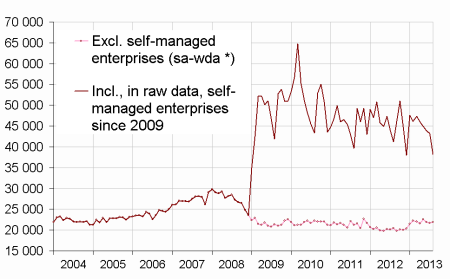
- * Seasonally and working-day adjusted data
- Source: INSEE (Sirene)
Pour en savoir plus
Time series : Business demography
