


 16 October 2013
2013- n° 237Increase in business start-ups in September 2013 Enterprise births - September 2013
16 October 2013
2013- n° 237Increase in business start-ups in September 2013 Enterprise births - September 2013
In September 2013, the number of business start-ups increased compared to August: 4.6% for business setting up (seasonally and working-day adjusted data) including self-managed enterprises, +0.9% for business start-ups excluding self-managed enterprises (seasonally and working-day adjusted data).
Warning : From September 2013 data onwards, the seasonal and working-day adjustment model has been modified, for monthly business start-up data. Previously, only the time series for business set-ups excluding self-managed enterprises were seasonally adjusted. The self-managed enterprises time series were too short to be properly deseasonalized. From now on, the self-managed enterprises time series are seasonaly adjusted for each main sector throughout France. However, for the self-managed enterprises time series in the sectors of “Financial and insurance activities”, “Real estate” and “Trade, transport, accomModation and catering” , the raw data are similar to seasonally adjusted data, due to a low number of registrations and difficulty identifying a seasonal trend.
In September 2013, the number of business start-ups increased compared to August: 4.6% for business setting up (seasonally and working-day adjusted data) including self-managed enterprises, +0.9% for business start-ups excluding self-managed enterprises (seasonally and working-day adjusted data).
-1.4% year-on-year (quarterly basis)
The amount of entries added up in the last quarter decreased compared to the same quarter one year before (-1.4%).
The sectors that most contributed to that decrease were construction, household services and business support activities.
-3.1% year-on-year (twelve months basis)
During the last twelve months, the number of business start-ups decreased by 3.1% year-on-year.
206,862 self-managed enterprises since the beginning of 2013
For the first nine months of 2013, more than one out of two businesses set up were self-managed enterprises (206,862).
tableautab0 – Self-managed business set-ups
| June 2013 | July 2013 | Aug. 2013 | Sept. 2013 |
|---|---|---|---|
| 21 937 | 21 331 | 16 226 | 25 434 |
- Source: INSEE (Sirene)
tableautab1EN – Business set-ups by month
| June 2013 | July 2013 | Aug. 2013 | Sept. 2013 | |
|---|---|---|---|---|
| Excl. self-managed enterprises (sa-wda *) | 21 921 | 21 758 | 21 805 | 22 004 |
| Variation [m-o-m] % | -2.7 | -0.7 | 0.2 | 0.9 |
| Incl., self-managed enterprises | 44 381 | 44 624 | 44 006 | 46 028 |
| Variation [m-o-m] % | -2.4 | 0.5 | -1.4 | 4.6 |
- * Seasonally and working-day adjusted data
- Source: INSEE (Sirene)
tableautab2EN – business start-ups by type
| Moving total % change* | Moving total | Moving total | ||
|---|---|---|---|---|
| over 3 months | over 12 months | January- September 2013 | January- September 2012 | |
| Total | -1.4 | -3.1 | 403 598 | 416 788 |
| Companies | 1.3 | -2.6 | 117 694 | 119 601 |
| Individual enterprises | -2.5 | -3.3 | 285 904 | 297 187 |
| Of which self-managed | -11.2 | -9.0 | 206 862 | 234 306 |
- * Total of business start-ups during the last 3 or 12 months compared with the same months a year earlier
- // = meaningless
- Source: INSEE (Sirene)
graphiqueGraph1EN – Business start-ups
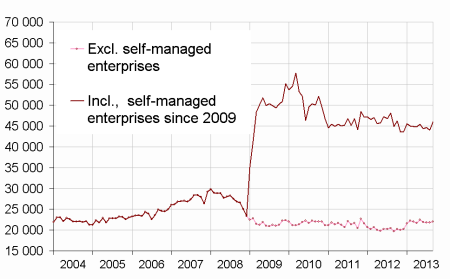
- * Seasonally and working-day adjusted data
- Source: INSEE (Sirene)
Pour en savoir plus
Time series : Business demography
