


 8 December 2011
2011- n° 299Stagnation in payroll employment in Q3 2011 Payroll employment - 3rd Quarter 2011
8 December 2011
2011- n° 299Stagnation in payroll employment in Q3 2011 Payroll employment - 3rd Quarter 2011
After +53,600 jobs in Q2 2011, payroll employment in principally market sectors stagnated in Q3 : +3,600.
Stagnation in payroll employment in principally market sectors in Q3 2011
After +53,600 jobs in Q2 2011, payroll employment in principally market sectors stagnated in Q3 : +3,600.
Employment stagnated q-o-q and increased by 1.2% y-o-y in principally market sectors.
tableautableau_1 – Payroll employment change in the competitive sector : thousands …
SA data in thousands
| Change in 3 months | Change in 1 year | Level | ||
|---|---|---|---|---|
| 2011 | 2011 | 2011 | 2011 | |
| Q2 | Q3 | Q3 | Q3 | |
| Principally market sectors | 53,6 | 3,6 | 186,4 | 16133,2 |
| Goods-producing industries excl. Construction | –0,4 | –4,6 | 1,0 | 3291,3 |
| Manufacturing | –1,9 | –5,5 | –5,5 | 2918,8 |
| Construction | –3,9 | 3,1 | –0,5 | 1446,1 |
| Services | 57,9 | 5,0 | 186,0 | 11395,8 |
| of which : Temporary employment | 1,5 | –16,0 | 20,1 | 587,5 |
| Principally non-market sectors (*) | 6,7 | 5,1 | 15,0 | 1931,6 |
| Total competitive sector (*) | 60,3 | 8,6 | 201,5 | 18064,8 |
- (*) Excl. agriculture and public employees in non-markets sectors (administration, health, education and social activity)
- Source : INSEE
tableautableau_2 – ... Percentage
SA data in %
| Change in 3 months | Change in 1 year | ||
|---|---|---|---|
| 2011 | 2011 | 2011 | |
| Q2 | Q3 | Q3 | |
| Principally market sectors | 0,3 | 0,0 | 1,2 |
| Goods-producing industries excl. Construction | 0,0 | –0,1 | 0,0 |
| Manufacturing | –0,1 | –0,2 | –0,2 |
| Construction | –0,3 | 0,2 | 0,0 |
| Services | 0,5 | 0,0 | 1,7 |
| of which : Temporary employment | 0,3 | –2,7 | 3,5 |
| Principally non-market sectors (*) | 0,3 | 0,3 | 0,8 |
| Total competitive sector (*) | 0,3 | 0,0 | 1,1 |
- (*) Excl. agriculture and public employees in non-markets sectors (administration, health, education and social activity)
- Source : INSEE
tableautableau_4 – Payroll employment change in the competitive sector (*)
SA data in thousands
| Code | Change in 3 months | Change in 1 year | Level | ||
|---|---|---|---|---|---|
| Naf | 2011 | 2011 | 2011 | 2011 | |
| rev.2 | Q2 | Q3 | Q3 | Q3 | |
| DE | Electricity, gas, steam, and air conditioning supply ; water supply, sewerage, waste management and remediation activities | 1,5 | 1,0 | 6,5 | 372,5 |
| C1 | Manufacture of food products beverage and tobacco products | –0,4 | –0,9 | 0,0 | 546,1 |
| C2 | Manufacture of coke, and refined petroleum products | –0,2 | 0,2 | –0,6 | 11,1 |
| C3 | Manufacture of computer, electronic and electrical products; manufacture of machinery and equipment | –1,7 | –2,5 | –3,1 | 454,9 |
| C4 | Manufacture of transport equipment | 1,4 | 1,6 | 5,9 | 368,0 |
| C5 | Other manufacturing | –1,1 | –3,9 | –7,5 | 1538,8 |
| FZ | Construction | –3,9 | 3,1 | –0,5 | 1446,1 |
| GZ | Wholesale and retail trade ; repair of motor vehicles and motorcycles | 14,6 | 1,6 | 28,8 | 3022,8 |
| HZ | Transportation and storage | 5,0 | 2,3 | 8,9 | 1333,0 |
| IZ | Accommodation and food service activities | 13,5 | 1,8 | 28,5 | 973,1 |
| JZ | Information and communication | 4,6 | 3,7 | 19,2 | 711,5 |
| KZ | Financial and insurance activities | 3,6 | 5,4 | 16,9 | 861,4 |
| LZ | Real estate activities | 1,6 | 0,1 | 3,9 | 235,5 |
| MN | Professional, scientific and technical activities; administrative and support service activities | 17,4 | –7,4 | 78,2 | 2932,9 |
| of which : Temporary employment | 1,5 | –16,0 | 20,1 | 587,5 | |
| OQ | Public administration and defence ; compulsory social security; education; human health and social work activities | 6,7 | 5,1 | 15,0 | 1931,6 |
| RU | Other service activities | –2,4 | –2,5 | 1,6 | 1325,6 |
- (*) Excl. Agriculture and public employees in non-markets sectors (administration, health, education and social activity)
- Source : INSEE
graphiqueGraph1 – Payroll employment in principally market sectors
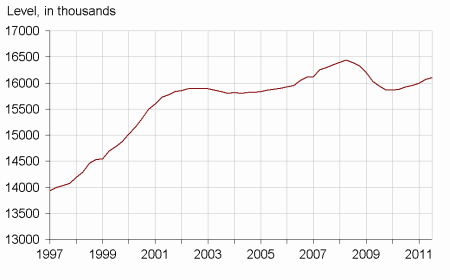
- Source : INSEE
Documentation
Methodology (pdf,135 Ko)
Pour en savoir plus
: bureau-de-presse@insee.fr
