


 9 June 2011
2011- n° 144Rise of payroll employment in Q1 2011 Payroll employment - 1st Quarter 2011
9 June 2011
2011- n° 144Rise of payroll employment in Q1 2011 Payroll employment - 1st Quarter 2011
After +48,300 jobs in Q4 2010, payroll employment in principally market sectors went up in Q1 : +58,200.
Payroll employment in principally market sectors up by 58,200 in Q1 2011
After +48,300 jobs in Q4 2010, payroll employment in principally market sectors went up in Q1 : +58,200.
Employment increased by 0.4% q-o-q and by 1.1% y-o-y in principally market sectors.
tableautableau_1 – Payroll employment change in the competitive sector : thousands …
SA data in thousands
| Change in 3 months | Change in 1 year | Level | ||
|---|---|---|---|---|
| 2010 | 2011 | 2011 | 2011 | |
| Q4 | Q1 | Q1 | Q1 | |
| Principally market sectors | 48,3 | 58,2 | 181,7 | 16079,5 |
| Goods-producing industries excl. Construction | –3,5 | 1,3 | –32,8 | 3293,3 |
| Manufacturing | –5,2 | –0,3 | –36,7 | 2915,9 |
| Construction | –3,6 | 3,0 | –6,3 | 1429,4 |
| Services | 55,3 | 53,9 | 220,9 | 11356,9 |
| of which : Temporary employment | 22,5 | 5,9 | 72,6 | 598,4 |
| Principally non-market sectors (*) | 5,8 | 1,9 | 41,3 | 1922,0 |
| Total competitive sector (*) | 54,1 | 60,1 | 223,1 | 18001,4 |
- (*) Excl. Agriculture and public employees in non-markets sectors (administration, health, education and social activity) ; na : not available
- Source : INSEE
tableautableau_2 – ... Percentage
SA data in %
| Change in 3 months | Change in 1 year | ||
|---|---|---|---|
| 2010 | 2011 | 2011 | |
| Q4 | Q1 | Q1 | |
| Principally market sectors | 0,3 | 0,4 | 1,1 |
| Goods-producing industries excl. Construction | –0,1 | 0,0 | –1,0 |
| Manufacturing | –0,2 | 0,0 | –1,2 |
| Construction | –0,2 | 0,2 | –0,4 |
| Services | 0,5 | 0,5 | 2,0 |
| of which : Temporary employment | 3,9 | 1,0 | 13,8 |
| Principally non-market sectors (*) | 0,3 | 0,1 | 2,2 |
| Total competitive sector (*) | 0,3 | 0,3 | 1,3 |
- (*) Excl. Agriculture and public employees in non-markets sectors (administration, health, education and social activity) ; na : not available
- Source : INSEE
tableautableau_4 – Payroll employment change in the competitive sector (*)
SA data in thousands
| Code | Change in 3 months | Change in 1 year | Level | ||
|---|---|---|---|---|---|
| Naf | 2010 | 2011 | 2011 | 2011 | |
| rev.2 | Q4 | Q1 | Q1 | Q1 | |
| DE | Electricity, gas, steam, and air conditioning supply ; water supply, sewerage, waste management and remediation activities | 1,8 | 1,6 | 3,9 | 377,4 |
| C1 | Manufacture of food products beverage and tobacco products | 1,6 | –0,4 | –0,8 | 550,0 |
| C2 | Manufacture of coke, and refined petroleum products | –0,2 | 0,1 | –0,3 | 11,4 |
| C3 | Manufacture of computer, electronic and electrical products; manufacture of machinery and equipment | –0,9 | –1,9 | –9,8 | 466,7 |
| C4 | Manufacture of transport equipment | –0,1 | 2,6 | –3,4 | 351,5 |
| C5 | Other manufacturing | –5,7 | –0,6 | –22,4 | 1536,2 |
| FZ | Construction | –3,6 | 3,0 | –6,3 | 1429,4 |
| GZ | Wholesale and retail trade ; repair of motor vehicles and motorcycles | 4,3 | 7,5 | 14,2 | 2980,3 |
| HZ | Transportation and storage | 0,1 | –2,9 | –2,0 | 1310,9 |
| IZ | Accommodation and food service activities | 0,3 | 13,9 | 21,2 | 951,3 |
| JZ | Information and communication | 6,7 | 5,2 | 17,1 | 695,1 |
| KZ | Financial and insurance activities | 2,1 | 4,6 | 12,4 | 844,4 |
| LZ | Real estate activities | 1,0 | 0,1 | 3,5 | 234,4 |
| MN | Professional, scientific and technical activities; administrative and support service activities | 33,9 | 26,0 | 122,7 | 2934,8 |
| of which : Temporary employment | 22,5 | 5,9 | 72,6 | 598,4 | |
| OQ | Public administration and defence ; compulsory social security; education; human health and social work activities | 5,8 | 1,9 | 41,3 | 1922,0 |
| RU | Other service activities | 6,8 | –0,5 | 31,9 | 1405,6 |
- (*) Excl. Agriculture and public employees in non-markets sectors (administration, health, education and social activity)
- Source : INSEE
graphiqueGraph1 – Payroll employment in principally market sectors
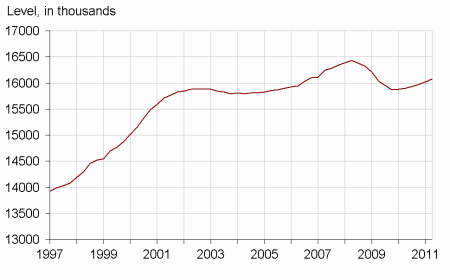
- Source : INSEE
Documentation
Methodology (pdf,135 Ko)
Pour en savoir plus
: bureau-de-presse@insee.fr
