


 24 March 2011
2011- n° 74In March 2011, the economic climate in services continues to improve Monthly survey of services - March 2011
24 March 2011
2011- n° 74In March 2011, the economic climate in services continues to improve Monthly survey of services - March 2011
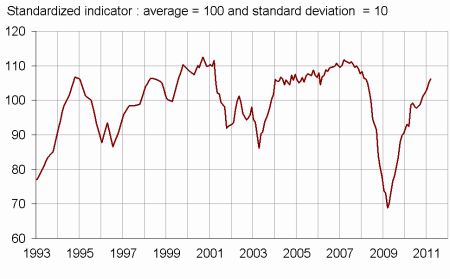
According to the business leaders surveyed in March, the economic situation in services continues to improve. The business climate synthetic indicator has risen once more and is 106 in March, that is well above its long-term average. The turning point indicator stays in the favourable area.
According to the business leaders surveyed in March, the economic situation in services continues to improve. The business climate synthetic indicator has risen once more and is 106 in March, that is well above its long-term average. The turning point indicator stays in the favourable area.
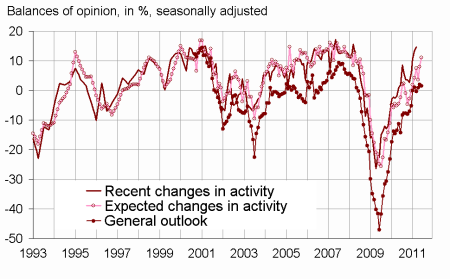
Activity has risen at a brisk pace in the last few months. It should remain sustained in the months to come. Indeed, the business leaders surveyed consider that demand should be very favourable in the following months, and they revise slightly upwards their activity expectations.
As for the general outlook, it remains unchanged.
graphiqueGraph1 – Business climate synthetic indicator
graphiquegraph_retourn – Turning point indicator
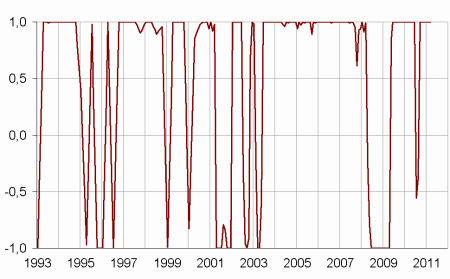
- Note: close to 1 (respectively -1), this indicator indicates a favourable short-term economic situation (respectively unfavourable).
graphiqueGraph2 – Activity
tableauTable_quarter – Economic outlook in the services sector
| Average* | Dec. 10 | Jan. 11 | Feb. 11 | Mar. 11 | |
|---|---|---|---|---|---|
| Business climate synthetic indicator | 100 | 102 | 103 | 105 | 106 |
| General outlook | –5 | 0 | 1 | 2 | 2 |
| Past activity | 4 | 6 | 11 | 13 | 15 |
| Expected activity | 4 | 8 | 4 | 8 | 11 |
| Expected demand | 2 | 11 | 9 | 11 | 14 |
| Business situation | 1 | 5 | 4 | 5 | 5 |
| Past selling prices | –2 | –5 | –5 | –3 | 0 |
| Expected selling prices | –1 | 1 | 1 | 5 | 6 |
| Past employment | 3 | 12 | 6 | 14 | 10 |
| except temporary work agencies | 1 | 0 | 0 | 4 | 6 |
| Expected employment | 3 | 13 | 8 | 13 | 10 |
| except temporary work agencies | 0 | 3 | –1 | 7 | 4 |
| Investments | |||||
| Past investments | 2 | 0 | 7 | 10 | 8 |
| Expected investments | 1 | 2 | 1 | 5 | 8 |
- * Average of the balances of opinion since 1988
- Source: Insee
Documentation
Methodology (2016) (pdf,158 Ko)
Pour en savoir plus
Time series : Economic outlook surveys – Services
