


 10 March 2011
2011- n° 63In January 2011, manufacturing output increased (+1.8%) Industrial production index - January 2011
10 March 2011
2011- n° 63In January 2011, manufacturing output increased (+1.8%) Industrial production index - January 2011
In January 2011, manufacturing output increased in volume (+1.8%). It was almost stable in December 2010 (-0.2%). It was mainly driven by output of intermediate goods that meets the demands of Construction, rebounding after the trough of December due to climatic conditions. In the industry, output increased as well (+1.0%).; in January, the decrease in energy was due to a lower consumption of gas and electricity, still in line with the climatic conditions In the last three months (quarter-on-quarter change), the output increased in the manufacturing sector (+2.0 %) and in the industry as a whole (+2.2%).
In January 2011, manufacturing output increased in volume (+1.8%). It was almost stable in December 2010 (-0.2%). It was mainly driven by output of intermediate goods that meets the demands of Construction, rebounding after the trough of December due to climatic conditions.
In the industry, output increased as well (+1.0%).; in January, the decrease in energy was due to a lower consumption of gas and electricity, still in line with the climatic conditions
In the last three months (quarter-on-quarter change), the output increased in the manufacturing sector (+2.0 %) and in the industry as a whole (+2.2%).
In the last three months, manufacturing output increased (+2.0%)…
In the last three months, the output increased in the “other manufacturing” (+1.6%, q-o-q), in the manufacture of transport equipment (+4.4%), in the electrical, electronic equipment and machine equipment (+2.4%) and in the manufacture of coke and refined petroleum products (+14.8%). It remained stable in the manufacture of food products and beverages (-0.1%).
…and exceeded it’s last year’s level by 6.1%
Manufacturing output rose by 6.1% (y-o-y). It soared in the “other manufacturing” (+6.7%), in the electrical and electronic equipment and machine equipment (+8.6%) and in the manufacture of transport equipment (+6.0%).
Please note: all the data are adjusted for seasonal variations (SA) and the number of working days (WDA).
graphiqueGraphique1a – Monthly Industrial Production indexes
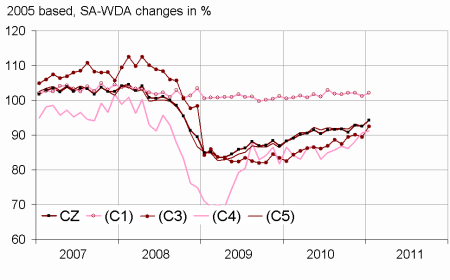
- Legend : CZ : Manufacturing - (C1) : Manufacture of food products and beverages - (C3) : Electrical and electronic equipment; machine equipment - (C4) : Manufacture of transport equipment - (C5) : Other manufacturing
- Sources : INSEE, SSP, SOeS
tableauTableau1a – Variation of Industrial Production
| NA : A10, (A17) | Jan. / Dec. | Dec. / Nov. | Quarter on quarter change | Year on year change (1) |
|---|---|---|---|---|
| BE: INDUSTRY | 1,0 | 0,2 | 2,2 | 6,1 |
| CZ: MANUFACTURING | 1,8 | –0,2 | 2,0 | 6,1 |
| (C1): Manufacture of food products and beverages | 0,9 | –0,9 | –0,1 | 1,1 |
| (C2): Manufacture of coke and refined petroleum products | –0,6 | 1,8 | 14,8 | 8,4 |
| (C3): Electrical and electronic equipment; machine equipment | 3,5 | –0,8 | 2,4 | 8,6 |
| (C4): Manufacture of transport equipment | 0,6 | 2,8 | 4,4 | 6,0 |
| (C5): Other manufacturing | 1,9 | –0,8 | 1,6 | 6,7 |
| (DE): Mining and quarrying; energy; water supply; waste management | –4,0 | 3,1 | 3,6 | 6,2 |
| FZ: Construction | 7,9 | –5,9 | –0,8 | –1,6 |
- (1) Last three months / three same months of previous year
- The codes correspond to the level of aggregation A 10 (A 17) of the "NA" aggregate classification based on NAF rev.2.
- Sources : INSEE, SSP, SOeS
tableauTableau2a – Variation of Industrial Production by activity (NA)
| NA : A10, (A17), [A38 ou A64] | Jan. 2011 | Jan. / Dec. | Dec. / Nov. | Quarter on quarter change |
|---|---|---|---|---|
| BE: INDUSTRY | 95,1 | 1,0 | 0,2 | 2,2 |
| CZ: MANUFACTURING | 94,3 | 1,8 | –0,2 | 2,0 |
| (C1): Man. of food products and beverages | 102,1 | 0,9 | –0,9 | –0,1 |
| (C2): Man. of coke and refined petroleum products | 78,4 | –0,6 | 1,8 | 14,8 |
| (C3): Electrical and electronic equipment; machine equipment | 92,5 | 3,5 | –0,8 | 2,4 |
| [CI] Man. of computer, electronic and optical products | 97,1 | 8,0 | –1,3 | 4,3 |
| [CJ] Man. of electrical equipment | 102,9 | 2,8 | –1,9 | 2,1 |
| [CK] Man. of machinery and equipment n.e.c. (1) | 83,3 | 0,6 | 0,4 | 1,1 |
| (C4): Man. of transport equipment | 91,2 | 0,6 | 2,8 | 4,4 |
| [CL1] Man. of motor vehicles, trailers and semi-trailers | 76,2 | 1,5 | 0,3 | 8,3 |
| [CL2] Man. of other transport equipment | 121,6 | –0,7 | 6,2 | –0,2 |
| (C5): Other manufacturing | 94,3 | 1,9 | –0,8 | 1,6 |
| [CB] Man. of textiles, wearing apparel, leather and related products | 62,2 | 0,6 | –1,3 | 1,2 |
| [CC] Man. of wood and paper products; printing and reproduction of recorded media | 83,0 | 3,0 | –1,6 | 0,0 |
| [CE] Man. of chemicals and chemical products | 113,6 | 2,7 | 0,0 | 3,8 |
| [CF] Man. of basic pharmaceutical products and pharmaceutical preparations | 123,4 | –0,2 | –0,6 | –2,2 |
| [CG] Man. of rubber and plastics products, and other non-metallic mineral products | 91,8 | 8,5 | –2,3 | 3,1 |
| [CH] Man. of basic metals and fabricated metal products, except machinery and equipment | 83,7 | 1,5 | –0,4 | 2,8 |
| [CM] Other manufacturing; repair and installation of machinery and equipment | 106,0 | –2,3 | –0,4 | 0,7 |
| (DE): Mining and quarrying; energy; water supply; waste management | 100,8 | –4,0 | 3,1 | 3,6 |
| [BZ] Mining and quarrying | 84,9 | 9,4 | –11,3 | –5,7 |
| [DZ] Electricity, gas, steam and air-conditioning supply | 102,4 | –5,1 | 4,5 | 4,4 |
| [EZ] Water supply; sewerage, waste management and remediation | 99,3 | –1,1 | 1,5 | 2,8 |
| FZ: Construction | 95,5 | 7,9 | –5,9 | –0,8 |
| MIGs (2) | ||||
| Capital goods | 86,4 | 0,6 | 0,9 | 2,4 |
| Intermediate goods | 84,9 | 4,3 | –1,5 | 2,8 |
| Consumer durables | 78,4 | 0,7 | 1,5 | –2,5 |
| Consumer non-durables | 105,4 | 0,6 | –0,6 | –0,1 |
- (1) n.e.c. : not elsewhere classifiable
- (2) Main industrial groupings : definition in Commission regulation EC of 14 June 2007
- Sources : Insee, SSP, SOeS
In January 2011, output increased in the « other manufacturing » (+1.9%)…
Output strongly increased in the manufacture of rubber or plastics products, and other non-metallic mineral products (+8,5%).It also increased in the manufacture of basic metals and fabricated metal products (+1.5%), in the manufacture of chemicals and chemical products (+2.7%) and in the manufacture of wood and paper products; printing and reoutput of recorded media (+3.0%).
In the other hand, output decreased in the “other manufacturing, repair and installation of machinery” (-2.3%).
…in the manufacture of electrical or electronic equipment and machine equipment (+3.5%)…
Output strongly increased in the manufacture of computer, electronic and optical products (+8.0%). It also increased in the manufacture of electrical equipment (+2.8%) and more slightly in manufacture of machinery and equipment n.e.c. (+0.6%).
…and slightly increased in the manufacture of transport equipment (+0.6%)
Output increased in the manufacture of motor vehicles, trailers and semi-trailers (+1.5%) and decreased in the manufacture of other transport equipment (-0.7%).
Revisions : -0.11 point in December
In December 2011, manufacturing output was almost stable (-0.2%)
The revision of the raw series, due to delayed firms’ answers, especially apply to the manufacture of of machinery and equipment n.e.c. and to the “other manufacturing repair and installation of machinery”. The new calculation of the SA-WDA especially applies to the manufacture of rubber or plastics products, and other non-metallic mineral products.
tableauTableau3a – Measure of variations’ revisions
| Dec. / Nov. | Nov. / Oct. | Oct. / Sept. | Q4 2010 / Q3 2010 | 2010 / 2009 | |
|---|---|---|---|---|---|
| Industry (BE) | –0,11 | 0,00 | 0,00 | 0,07 | 0,01 |
| raw serie | 0,21 | –0,10 | 0,00 | 0,00 | –0,01 |
| SA-WDA coefficient | –0,32 | 0,10 | 0,00 | 0,07 | 0,02 |
| Manufacturing (CZ) | –0,11 | 0,00 | 0,00 | 0,07 | –0,01 |
| raw serie | 0,21 | –0,20 | 0,10 | 0,04 | 0,01 |
| SA-WDA coefficient | –0,32 | 0,20 | –0,10 | 0,03 | –0,02 |
- Note of reading : in the manufacturing, the SA-WDA evolution between November and December is revised by -0.11 point : 0.21 is due to the raw serie's revision and -0.32 to the new calculation of the SA-WDA.
- Sources : Insee, SSP, SOeS
Documentation
Methodology (pdf,163 Ko)
Pour en savoir plus
