


 6 May 2011
2011- n° 117In April 2011, the price of oil continued to rise Prices of oil and raw material imports - April 2011
6 May 2011
2011- n° 117In April 2011, the price of oil continued to rise Prices of oil and raw material imports - April 2011
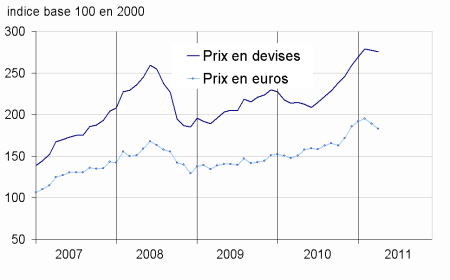
In April, the price of oil in dollars rose again strongly (+7.9 % after +10,6 % in March) to reach $123.6 per barrel Brent. The foreign currencies prices for non-energy commodities imported in France continued to decline slightly ( 0.2 % après -0.4 % in March).
In April, the price of oil in dollars rose again strongly (+7.9 % after +10,6 % in March) to reach $123.6 per barrel Brent. The foreign currencies prices for non-energy commodities imported in France continued to decline slightly (–0.2 % après -0.4 % in March).
The price of oil continued to grow
In April, the dollar price of oil from the North Sea (Brent) continued to rise (+7.9 % after +10.6 %). In euros, the rise in oil prices was lower (+4.7 %) due to the appreciation of the euro against the dollar (+3,1 %). Over the last three months, the price of oil rose by 28.2 % in dollars and 18.6 % in euros.
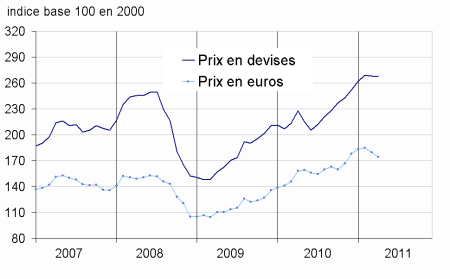
Price of industrial raw materials stabilized
In April, prices of industrial raw materials in foreign currencies stabilized (+0.1 % after -0.4 %). The prices of mineral raw materials rebounded (+0.7 % after -0.3%). On the one hand, precious metals rose again (+9.4 % after +7.5 %) due to the rebound in prices of palladium (+1.3 % after -7.3 %) and platinum (+1.4 % after -3.2 %), and acceleration of prices of silver (+17.2 % after +16.4 %). On the other hand, prices of nonferrous metals started to rebound (+1.7 % after -1.4 %), including lead (+4.5%) and aluminium (+4.3 %).
However, the decline in prices of agro-industrial raw materials increased (–1.5 % after -0.7 %). Prices of sawn wood of conifers sharply folded (-10,7 %) as well as prices of natural fiber textiles (–6.1 %), including cotton (-6.9 %).
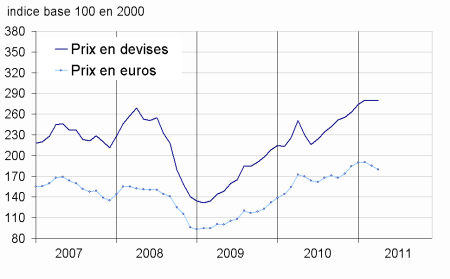
Lower prices of raw food materials continued
In April, prices of raw food materials in foreign currencies declined again (–0.7 % after –0.4 %). The drop in sugar prices continued (–9.7 % after -11.4 %) and tropical beverages decreased (–3.0 % after +0.8 %), including cocoa (–7.8 %), the resumption of exports in Côte d’Ivoire, which represents about one third of the world cocoa market. Cereals prices rebounded (+2.3 % after –3,6 %), mainly because of higher price of corn (+10.2 %). The drop in stocks in U.S. and poor crop prospects (U.S.A, Argentina and Mexico in particular) suggest waiting a slowdown in the global supply of corn, while the demand remains strong.
tableautabpetrole – Oil and petroleum products
| Prices | Change (%) | ||||
|---|---|---|---|---|---|
| over the last month | over the last month | over the last 3 months | over the last 12 months | ||
| Brent in $ per barrel | 123,6 | 7,9 | 28,2 | 45,7 | |
| Brent in € per barrel | 85,5 | 4,7 | 18,6 | 35,3 | |
| Gasoline | 1139,9 | 8,3 | 36,1 | 43,8 | |
| Gas Oil | 1022,8 | 5,1 | 27,4 | 43,4 | |
| Heavy fuel | 631,3 | 7,3 | 31,5 | 41,9 | |
| Naphta | 1051,9 | 7,7 | 23,5 | 43,9 | |
- Prices are in dollars per tonne unless otherwise specified
- Source : Insee
tableautabmatprem – Imported raw materials (excluding energy) in domestic currency
| Index | Changes (%) | |||
|---|---|---|---|---|
| over last month | over last month | over the last 3 months | over the last 12 months | |
| Food total | 275,3 | –0,7 | 2,2 | 28,3 |
| Tropical beverages | 302,0 | –3,0 | 7,1 | 30,0 |
| Oil seeds, vegetable oils | 293,2 | 0,5 | –2,4 | 30,4 |
| Cereals | 286,0 | 2,3 | 2,9 | 39,7 |
| Sugar | 312,2 | –9,7 | –20,8 | 57,7 |
| Beef meat | 168,3 | 1,3 | 10,4 | 11,8 |
| Industrial raw materials | 279,7 | 0,1 | 2,1 | 11,7 |
| Agricultural raw materials | 170,7 | –1,5 | –2,9 | 6,7 |
| Natural Fibers | 403,1 | –6,1 | 18,5 | 128,5 |
| Natural rubber | 603,9 | 2,8 | –7,0 | 40,5 |
| Hides | 110,1 | –1,3 | –3,6 | –4,3 |
| Wood pulp | 146,2 | 2,9 | 5,4 | 8,0 |
| Tropical wood | 156,4 | 1,3 | 3,8 | 14,7 |
| Sawn softwood | 102,1 | –10,7 | –14,5 | –14,6 |
| Minerals | 338,2 | 0,7 | 3,9 | 13,5 |
| Iron ore | 588,3 | –7,7 | –7,7 | –4,0 |
| Non-ferrous metals | 302,1 | 1,7 | 4,5 | 14,0 |
| Precious metals | 471,8 | 9,4 | 22,7 | 56,9 |
| All commodities | 267,6 | –0,2 | 2,1 | 17,4 |
- Source : Insee
graphiqueG_petrole – Oil
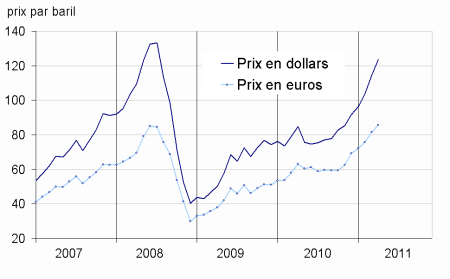
- Source : INSEE
graphiqueG_alim – Food
- Source : INSEE
graphiqueG_ensemble – All commodities
- Source : INSEE
graphiqueG_indus – Industrial raw materials
- Source : INSEE
Pour en savoir plus
Time series : Raw materials prices
