


 8 February 2011
2011- n° 102274n°246 In January 2011, The prices of the imported commodities continued to grow Prices of oil and raw material imports - January 2011
8 February 2011
2011- n° 102274n°246 In January 2011, The prices of the imported commodities continued to grow Prices of oil and raw material imports - January 2011
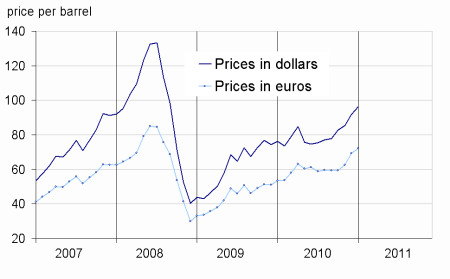
In January, the price of oil in dollars has also increased (+5.1% after +7.6% in December), reaching $96,4 per barrel of Brent. The foreign currency prices for non-energy commodities imported in France continued to grow (+3.9% after +3.7% in December).
In January, the price of oil in dollars has also increased (+5.1% after +7.6% in December), reaching $96,4 per barrel of Brent. The foreign currency prices for non-energy commodities imported in France continued to grow (+3.9% after +3.7% in December).
Downturn in oil prices in euros
In January, the prices in dollars of oil from the North Sea (Brent) has somewhat slowed down (+5.1% after 7.6%). In euros, the price of a barrel has slowed more sharply (+3.9% after 11.0%), due to the recovery of European currency vis-à-vis the dollar (+1.0% after -3.2% in December).
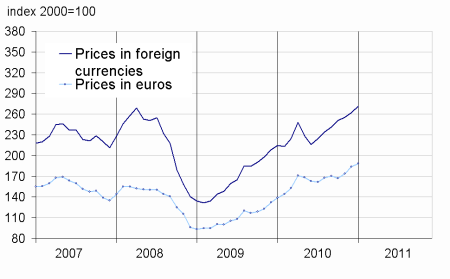
Further increase in the prices of imported industrial raw materials…
In January, the prices of industrial raw materials in foreign currencies have accelerated (+3.6% after +2.7%), driven by the mineral raw materials (+3.3% after 2.8%). The prices of nonferrous metals (+4.3% after after 3.0%) rose sharply, mainly lead (+7.8%) titanium (+7.2%) and zinc (+3.9%). In contrast, the prices of precious metals fell (-1.5% after +4.1%), including silver (-3.2% after +10.6%) and gold (-2.5% after +1.5%).
The prices of agro-industrial raw materials rose again (+4.4% after +2.6%) due to the sharp rise in wool (+15.8%), natural rubber (+11.6%) and coniferrous sawn timber (+7.7%).
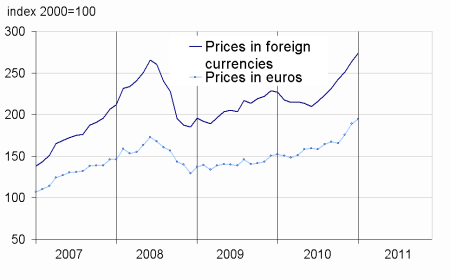
…And the prices of raw food materials imported
In January, the prices of raw food in foreign currencies have slowed (+4.3% after +5.9%), including cereals (+1.4% after +6.1%) and oilseeds, vegetable oils (+2.4% after +5.2%). The prices of tropical beverages have also slowed (+4.3% after +5.9%), including cocoa (+4.1% after +6.5%). Finally, the prices of sugar have risen less than in December (+3.0% after +7.9%).
tableautabpetrole – Oil and petroleum products
| Prices | Change (%) | |||
|---|---|---|---|---|
| of last month | over the last month | over the last 3 months | over the last 12 months | |
| Brent in $ per barrel | 96,4 | 5,1 | 16,6 | 26,5 |
| Brent in € per barrel | 72,2 | 4,0 | 21,5 | 35,2 |
| Gasoline | 837,8 | 1,0 | 9,6 | 19,0 |
| Gas Oil | 802,8 | 5,6 | 12,5 | 27,1 |
| Heavy fuel | 480,2 | 4,7 | 8,1 | 8,5 |
| Naphta | 852,0 | 1,0 | 13,6 | 19,4 |
- Prices are in dollars per tonne unless otherwise specified
- Source : INSEE
tableautabmatprem – Imported raw materials (excluding energy) in domestic currency
| Index | Changes (%) | |||
|---|---|---|---|---|
| over last month | over the last 3 months | over the last 12 months | ||
| Food total | 273,6 | 3,7 | 12,9 | 20,6 |
| Tropical beverages | 278,3 | 4,3 | 13,1 | 9,6 |
| Oil seeds, vegetable oils | 308,4 | 2,4 | 13,7 | 32,0 |
| Cereals | 280,6 | 1,4 | 9,6 | 16,2 |
| Sugar | 394,0 | 3,0 | 19,1 | 13,1 |
| Beef meat | 152,4 | 8,3 | 11,1 | 20,3 |
| Industrial raw materials | 271,8 | 3,6 | 8,5 | 26,5 |
| Agricultural raw materials | 174,4 | 4,4 | 13,5 | 29,2 |
| Natural Fibers | 339,3 | 6,2 | 38,3 | 112,2 |
| Natural rubber | 649,5 | 11,6 | 36,8 | 58,9 |
| Hides | 113,4 | 0,0 | –0,1 | 14,5 |
| Wood pulp | 138,7 | 0,9 | –1,8 | 15,8 |
| Tropical wood | 150,6 | 1,0 | 2,9 | 14,2 |
| Sawn softwood | 119,4 | 7,7 | 25,0 | 32,0 |
| Minerals | 322,9 | 3,3 | 6,6 | 25,5 |
| Iron ore | 632,2 | 0,0 | 0,0 | 80,3 |
| Non-ferrous metals | 286,1 | 4,3 | 7,8 | 17,5 |
| Precious metals | 369,3 | –1,5 | 7,6 | 29,5 |
| All commodities | 262,6 | 3,9 | 10,6 | 24,3 |
- Source : INSEE
graphiqueG_petrole_ang – Oil
graphiqueG_alim_ang – Source : INSEEFood
- Source : INSEE
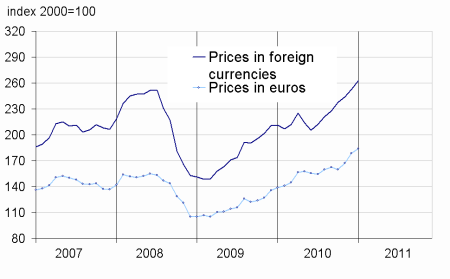
graphiqueG_ensemble_ang – All commodities
- Source : INSEE
graphiqueG_indus_ang – Industrial raw materials
- Source : INSEE
Pour en savoir plus
Time series : Raw materials prices
