


 9 November 2010
2010- n° 2742274n°246 The prices of the commodities imported were increased significantly in October Prices of oil and raw material imports - October 2010
9 November 2010
2010- n° 2742274n°246 The prices of the commodities imported were increased significantly in October Prices of oil and raw material imports - October 2010
In October, the price of oil in dollars has increased significantly (+6.3% after +0.9% in September) and reached $ 82.7$ per barrel of Brent. Meanwhile, the prices for non-energy commodities im-ported by France have again increased significantly (+5.5% in foreign currencies, after +3.4% in September).
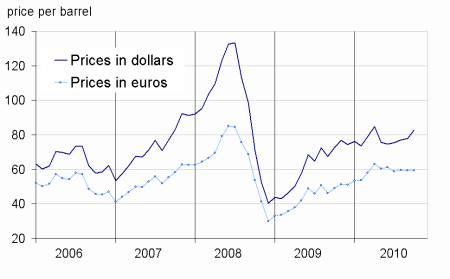
In October, the price of oil in dollars has increased significantly (+6.3% after +0.9% in September) and reached $ 82.7$ per barrel of Brent.
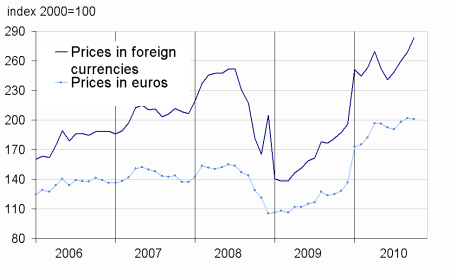
Meanwhile, the prices for non-energy commodities imported by France have again increased significantly (+5.5% in foreign currencies, after +3.4% in September).
The price of oil rebounded
In October, the dollar price of oil from the North Sea (Brent) rose (+6.3% after +0.9%). In euros, the prices of oil stagnated (+0.1%), due to the appreciation of the euro vis-à-vis the dollar (+6.2 %).
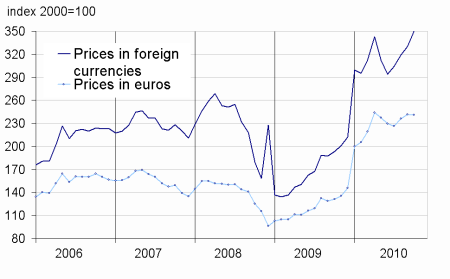
The Prices of industrial raw materials increased significantly
In October, the prices of industrial raw materials in foreign currencies rose (+5.9% after +3.5%). Among the mineral raw materials (+6.2% after +3.4%), the prices of nonferrous metals accelerated more strongly (+7.4% after +3.9%), with particularly strong increases in zinc (+10.0%), lead (+8.9%), aluminium (+8.5%) and copper (+7.6%). The prices of the metals precious continued to grow rapidly, notably silver (+13.8% after +11.9%), platinum (+6.1% after 3.3%) and gold (+5.6% after 4.5%).
The prices of agro-industrial raw materials also have accelerated (+5.0% after +3.8%) due to soaring natural fibers textiles (+19.8% after +14.4%, which +20.9% for cotton), natural rubber (+11.8% after +8.2%) and coniferous sawn timber (+6.1% after +5.5%).
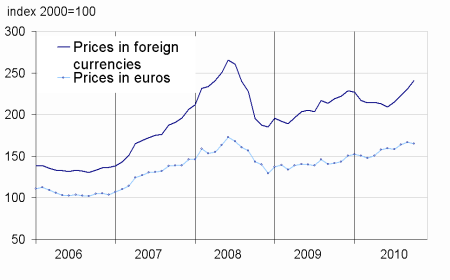
The prices of raw food materials rose again
In October, the prices of raw food in foreign currencies accentuated their increase (+4.5% after +3.3%). The prices of oilseeds have accelerated (+6.5% after +3.6%). Conversely, the pices of cereals have moderated somewhat (+8.4% after +10.5%), particularly corn (+13.0% after 18.2%). The price of sugar has also moderated (+13.6% after 23.4%), but it remained at a high level.
Finally, the prices of tropical beverages rose moderately (+2.7% after -1.4%) due to higher prices of robusta (+4.1%) and cocoa (+3.3%).
tableautabpetrole – Oil and petroleum products
| Prices | Change (%) | |||
|---|---|---|---|---|
| of last month | over the last month | over the last 3 months | over the last 12 months | |
| Brent in $ per barrel | 82,7 | 6,3 | 9,7 | 13,6 |
| Brent in € per barrel | 59,4 | 0,1 | 0,9 | 21,0 |
| Gasoline | 764,3 | 8,2 | 11,1 | 15,9 |
| Gas Oil | 713,8 | 6,1 | 11,8 | 16,5 |
| Heavy fuel | 444,1 | 6,1 | 9,9 | 7,4 |
| Naphta | 750,0 | 11,0 | 21,1 | 20,9 |
- Prices are in dollars per tonne unless otherwise specified
- Source : INSEE
tableautabmatprem – Imported raw materials (excluding energy) in domestic currency
| Index | Changes (%) | |||
|---|---|---|---|---|
| over last month | over the last 3 months | over the last 12 months | ||
| Food total | 241,1 | 4,5 | 12,0 | 9,9 |
| Tropical beverages | 246,1 | 2,7 | 0,4 | –2,3 |
| Oil seeds, vegetable oils | 267,9 | 6,5 | 17,3 | 18,4 |
| Cereals | 255,9 | 8,4 | 25,5 | 16,1 |
| Sugar | 330,8 | 13,6 | 52,9 | 16,3 |
| Beef meat | 137,2 | –1,6 | 2,6 | 13,2 |
| Industrial raw materials | 349,9 | 5,9 | 15,1 | 80,9 |
| Agricultural raw materials | 157,2 | 5,0 | 10,3 | 35,0 |
| Natural Fibers | 245,3 | 19,8 | 45,6 | 74,2 |
| Natural rubber | 474,7 | 11,8 | 26,2 | 52,6 |
| Hides | 113,4 | 2,2 | –2,0 | 39,0 |
| Wood pulp | 141,3 | –0,2 | –1,2 | 29,3 |
| Tropical wood | 146,3 | 0,5 | 1,1 | 8,5 |
| Sawn softwood | 95,5 | 6,1 | 14,3 | 30,3 |
| Minerals | 437,7 | 6,2 | 16,7 | 84,9 |
| Iron ore | 712,1 | 0,0 | 0,0 | 103,1 |
| Non-ferrous metals | 427,5 | 7,4 | 20,3 | 76,6 |
| Precious metals | 351,7 | 7,6 | 16,5 | 32,5 |
| All commodities | 283,6 | 5,5 | 14,0 | 56,1 |
- Source : INSEE
graphiqueG_petrole_ang – Oil
graphiqueG_alim_ang – Food
- Source : INSEE
- Source : INSEE
graphiqueG_ensemble_ang – All commodities
- Source : INSEE
graphiqueG_indus_ang – Industrial raw materials
- Source : INSEE
Pour en savoir plus
Time series : Raw materials prices
