


 18 November 2010
2010- n° 280A decrease in enterprise births in October 2010 Enterprise births - October 2010
18 November 2010
2010- n° 280A decrease in enterprise births in October 2010 Enterprise births - October 2010
In October 2010, the number of enterprise births decreased compared to September: -26.9% for enterprise births excluding self-managed enterprises (seasonally and working-day adjusted data); -8.5% when the number of self-managed enterprises (raw data) is added.
Warning : From the August issue, only enterprise births data excluding self-managed enterprises (SME) are seasonally adjusted. In order to get the total of enterprise births, the raw number of SME is added. The SME time series is too short to be properly deseasonalized.
In October 2010, the number of enterprise births decreased compared to September: -26.9% for enterprise births excluding self-managed enterprises (seasonally and working-day adjusted data); -8.5% when the number of self-managed enterprises (raw data) is added.
+2.2% year-on-year (quarterly basis)
The amount of entries, added up August, September and October 2010, increased by 2.2% compared to the same quarter one year before.
The sectors that most contributed to that increase were construction and education, human health and social work activities.
+19.9% year-on-year (twelve months basis)
During the last twelve months, the number of births climbed by 19.9% year-on-year.
309,057 self-managed enterprises since the beginning of 2010
From January to October 2010, more than one out of two births enterprises were self-managed enterprises (309,057).
tableautab0EN – Self-managed entreprise births
| July 2010 | Aug. 2010 | Sept. 2010 | Oct. 2010 |
|---|---|---|---|
| 23 930 | 21 155 | 31 036 | 33 290 |
- Source: INSEE (Sirene)
tableautab1EN – Enterprise births by month
| July 2010 | Aug. 2010 | Sept. 2010 | Oct. 2010 | |
|---|---|---|---|---|
| Excl. self-managed enterprises (sa-wda *) | 18 622 | 22 749 | 26 561 | 19 407 |
| Variation [m-o-m] % | -23.3 | 22.2 | 16.8 | -26.9 |
| Incl. self-managed enterprises (in raw data) | 42 552 | 43 904 | 57 597 | 52 697 |
| Variation [m-o-m] % | -15.2 | 3.2 | 31.2 | -8.5 |
- * Seasonally and working-day adjusted data
- Source: INSEE (Sirene)
tableautab2EN – Enterprise births by type
| Moving total % change* | Moving total | Moving total | ||
|---|---|---|---|---|
| over 3 months | over 12 months | January- October 2010 | January- October 2009 | |
| Total | 2.2 | 19.9 | 528 860 | 480 142 |
| Companies | 7.5 | 11.2 | 135 913 | 124 396 |
| Individual enterprises | 0.5 | 23.3 | 392 947 | 355 746 |
| Of which self-managed | 0.7 | // | 309 057 | 262 991 |
- * Total of enterprises births during the last 3 or 12 months compared with the same months a year earlier
- // = meaningless
- Source: INSEE (Sirene)
graphiqueGraph1EN – Enterprise births
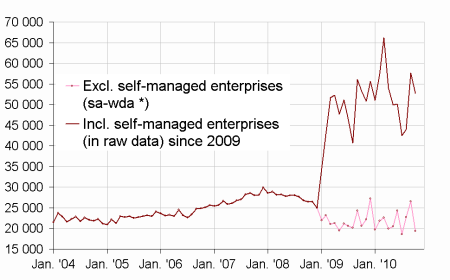
- * Seasonally and working-day adjusted data
- Source: INSEE (Sirene)
Pour en savoir plus
Time series : Business demography
