


 6 August 2010
2010- n° 202The commodities prices rebounded in July Prices of oil and raw material imports - July 2010
6 August 2010
2010- n° 202The commodities prices rebounded in July Prices of oil and raw material imports - July 2010
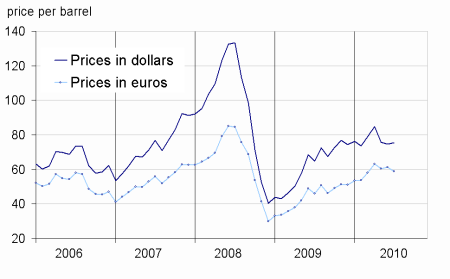
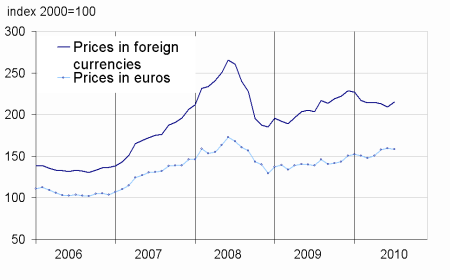
In July, the price of oil rebounded (+0.9% after -1.3% in June) and stood on average at $ 75.4 per barrel. Prices for non-energy commodities imported by France also rebounded (+2.1% in foreign currencies, after -4.5% in June).
In July, the price of oil rebounded (+0.9% after -1.3% in June) and stood on average at $ 75.4 per barrel.
Prices for non-energy commodities imported by France also rebounded (+2.1% in foreign currencies, after -4.5% in June).
The price of oil recovered
In July, the dollar price of oil from the North Sea (Brent) increased (+0.9% after -1.3% in June). Conversely, in euros, the price decreased (-3.7 %) due to the appreciation of euro vis-à-vis the dollar (+4.7 %).
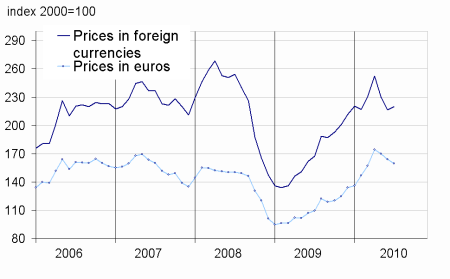
The Prices of industrial raw materials bounced
In July, the prices of industrial raw materials in foreign currencies rebounded (+1.7% after -5.8% in June). On the one hand, the prices of mineral materials increased (+2.0%). The prices of non-ferrous metals have almost all increased (+2.7%), including those of lead (+7,8%), zinc (+5.7%) and copper (+3.6%), while the titanium was depreciated (-5.6%). In contrast, the prices of precious metals all declined (-2.7%), including gold (-3.2%) and silver (-2.7 %).
On the other hand, the prices of agricultural raw materials stabilized (+ 0.8% after -7.0 % in June) : the increases in the prices of sawn softwood (+3.6%) and sawn timber tropical (+3.6%) were compensated by declines in cotton (-8.4%), natural fiber textiles (-7.0%) and natural rubber (-2.1%).
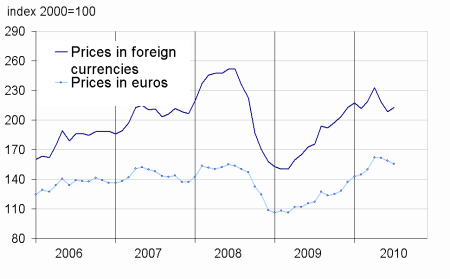
The prices of raw food materials were rebounding
In July, the prices of raw food in foreign currencies have rebounded (+3.0% after -1.8% in June). The prices of oilseeds, vegetable oils increased by 4.1%, mainly soybeans (+6.3% for soya bean and +6.2% for soybean meal). The prices of cereals rose 3.8%, including corn (+8.1%). The prices of tropical beverages increased by 3.1%, in particular that of coffee prices (+9.3% for robusta and +8.5% for arabica). The sugar prices continued to rise (+11.5% after +8.3 % in June) due to sustained demand in South-East Asia while the Brazilian production reached a plateau. In contrast, the price of beef meat has fallen by 1.4%.
tableautabpetrole – Oil and petroleum products
| Prices | Change (%) | |||
|---|---|---|---|---|
| of last month | over the last month | over the last 3 months | over the last 12 months | |
| Brent in $ per barrel | 75,4 | 0,9 | –11,1 | 16,4 |
| Brent in € per barrel | 58,9 | –3,7 | –6,8 | 28,1 |
| Gasoline | 687,8 | –2,3 | –13,2 | 11,4 |
| Gas Oil | 638,7 | –2,9 | –10,5 | 19,8 |
| Heavy fuel | 404,2 | –1,0 | –9,1 | 9,0 |
| Naphta | 619,3 | –5,0 | –15,3 | 13,4 |
- Prices are in dollars per tonne unless otherwise specified
- Source : INSEE
tableautabmatprem – Imported raw materials (excluding energy) in domestic currency
| Index | Changes (%) | |||
|---|---|---|---|---|
| over last month | over the last 3 months | over the last 12 months | ||
| Food total | 215,3 | 3,0 | 0,3 | 5,8 |
| Tropical beverages | 245,2 | 3,1 | 5,6 | 15,7 |
| Oil seeds, vegetable oils | 228,4 | 4,1 | 2,5 | 2,9 |
| Cereals | 203,9 | 3,8 | –0,4 | –10,7 |
| Sugar | 216,4 | 11,5 | 9,3 | –1,1 |
| Beef meat | 133,7 | –1,4 | –11,2 | 10,1 |
| Industrial raw materials | 220,1 | 1,7 | –12,8 | 31,6 |
| Agricultural raw materials | 142,5 | 0,8 | –11,5 | 36,4 |
| Natural Fibers | 169,0 | –7,0 | –4,2 | 29,0 |
| Natural rubber | 376,1 | –2,1 | –12,5 | 57,0 |
| Hides | 115,8 | –1,0 | 0,6 | 53,7 |
| Wood pulp | 143,0 | 0,7 | 5,7 | 50,5 |
| Tropical wood | 144,8 | 3,6 | 6,2 | 12,9 |
| Sawn softwood | 83,5 | 3,6 | –30,1 | 14,0 |
| Minerals | 260,5 | 2,0 | –13,2 | 30,0 |
| Iron ore | 612,7 | 0,0 | 0,0 | 74,7 |
| Non-ferrous metals | 225,3 | 2,7 | –15,9 | 23,9 |
| Precious metals | 302,0 | –2,7 | –2,0 | 31,9 |
| All commodities | 212,9 | 2,1 | –8,6 | 21,2 |
- Source : INSEE
graphiqueG_petrole_ang – Oil
graphiqueG_alim_ang – Food
- Source : INSEE
- Source : INSEE
graphiqueG_ensemble_ang – All commodities
- Source : INSEE
graphiqueG_indus_ang – Industrial raw materials
- Source : INSEE
Pour en savoir plus
Time series : Raw materials prices
