


 20 August 2010
2010- n° 208A decrease in enterprise births in July 2010 Enterprise births - July 2010
20 August 2010
2010- n° 208A decrease in enterprise births in July 2010 Enterprise births - July 2010
In July 2010, the number of enterprise births decreased compared to June: -23.1% for enterprise births excluding self-managed enterprises (seasonally and working-day adjusted data); -14.8% when the number of self-managed enterprises (raw data) is added.
Warning : From the August issue, only enterprise births data excluding self-managed enterprises (SME) are seasonally adjusted. In order to get the total of enterprise births, the raw number of SME is added. The SME time series is too short to be properly deseasonalized.
In July 2010, the number of enterprise births decreased compared to June: -23.1% for enterprise births excluding self-managed enterprises (seasonally and working-day adjusted data); -14.8% when the number of self-managed enterprises (raw data) is added.
-1.1% year-on-year (quarterly basis)
The amount of entries, added up May, June and July 2010, decreased by 1.1% compared to the same quarter one year before.
The sectors that most contributed to that decrease were wholesale and retail trade and household services.
+37.2% year-on-year (twelve months basis)
During the last twelve months, the number of births climbed by 37.2% year-on-year.
224,089 self-managed enterprises since the beginning of 2010
From January to July 2010, more than one out of two births enterprises were self-managed enterprises (224,089).
tableautab0EN – Self-managed entreprise births
| April 2010 | May 2010 | June 2010 | July 2010 |
|---|---|---|---|
| 34 002 | 29 350 | 26 108 | 24 239 |
- Source: INSEE (Sirene)

N. B. : The change in legislation on April 2010, concerning the registration of the self-managed entrepreneurs artisans, has almost no more impact. The underestimation of the number of self-managed entrepreneurs births and the overestimation of the number of other entreprise births became insignificant in June and July 2010. Therefore, the distribution between the two has not been corrected for June and July 2010.
graphiqueGraph1EN – Enterprise births
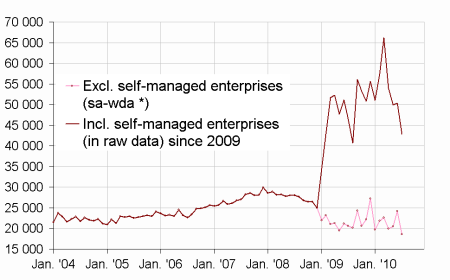
- * Seasonally and working-day adjusted data
- Source: INSEE (Sirene)
tableautab1EN – Enterprise births by month
| April 2010 | May 2010 | June 2010 | July 2010 | |
|---|---|---|---|---|
| Excl. self-managed enterprises (sa-wda *) | 19 894 | 20 548 | 24 209 | 18 627 |
| Variation [m-o-m] % | -12.3 | 3.3 | 17.8 | -23.1 |
| Incl. self-managed enterprises (in raw data) | 53 896 | 49 898 | 50 317 | 42 866 |
| Variation [m-o-m] % | -18.6 | -7.4 | 0.8 | -14.8 |
- * Seasonally and working-day adjusted data
- Source: INSEE (Sirene)
tableautab2EN – Enterprise births by type
| Moving total % change* | Moving total | Moving total | ||
|---|---|---|---|---|
| over 3 months | over 12 months | January- July 2010 | January- July 2009 | |
| Total | -1.1 | 37.2 | 383 233 | 337 180 |
| Companies | 11.1 | 8.6 | 98 980 | 89 972 |
| Individual enterprises | -5.2 | 51.0 | 284 253 | 247 208 |
| Of which self-managed | -5.4 | // | 224 089 | 178 080 |
- * Total of enterprise births during the last 3 or 12 months compared with the same months a year earlier
- // = meaningless
- Source: INSEE (Sirene)
Pour en savoir plus
Time series : Business demography
