


 15 September 2010
2010- n° 223An increase in enterprise births in August 2010 Enterprise births - August 2010
15 September 2010
2010- n° 223An increase in enterprise births in August 2010 Enterprise births - August 2010
In August 2010, the number of enterprise births increased compared to July (+3.5%).
Warning : From the August issue, only enterprise births data excluding self-managed enterprises (SME) are seasonally adjusted. In order to get the total of enterprise births, the raw number of SME is added. The SME time series is too short to be properly deseasonalized.
In August 2010, the number of enterprise births increased compared to July (+3.5%).
-0.7% year-on-year (quarterly basis)
The amount of entries, added up June, July and August 2010, decreased by 0.7% compared to the same quarter one year before.
The sectors that most contributed to that decrease were wholesale and retail trade and household services.
+33% year-on-year (twelve months basis)
During the last twelve months, the number of births climbed by 33.0% year-on-year.
244,982 self-managed enterprises since the beginning of 2010
From January to August 2010, more than one out of two births enterprises were self-managed enterprises (244,982).
tableautab0EN – Self-managed entreprise births
| May 2010 | June 2010 | July 2010 | Aug. 2010 |
|---|---|---|---|
| 29 350 | 25 904 | 24 009 | 21 327 |
- Source: INSEE (Sirene)
tableautab1EN – Enterprise births by month
| May 2010 | June 2010 | July 2010 | Aug. 2010 | |
|---|---|---|---|---|
| Excl. self-managed enterprises (sa-wda *) | 20 548 | 24 272 | 18 668 | 22 839 |
| Variation [m-o-m] % | 3.3 | 18.1 | -23.1 | 22.3 |
| Incl. self-managed enterprises (in raw data) | 49 898 | 50 176 | 42 677 | 44 166 |
| Variation [m-o-m] % | -7.4 | 0.6 | -14.9 | 3.5 |
- * Seasonally and working-day adjusted data
- Source: INSEE (Sirene)
tableautab2EN – Enterprise births by type
| Moving total % change* | Moving total | Moving total | ||
|---|---|---|---|---|
| over 3 months | over 12 months | January- August 2010 | January- August 2009 | |
| Total | -0.7 | 33.0 | 421 577 | 373 034 |
| Companies | 12.0 | 10.2 | 109 653 | 99 060 |
| Individual enterprises | -5.2 | 43.5 | 311 924 | 273 974 |
| Of which self-managed | -6.9 | // | 244 982 | 198 581 |
- * Total of enterprises births during the last 3 or 12 months compared with the same months a year earlier
- // = meaningless
- Source: INSEE (Sirene)
graphiqueGraph1EN – Enterprise births
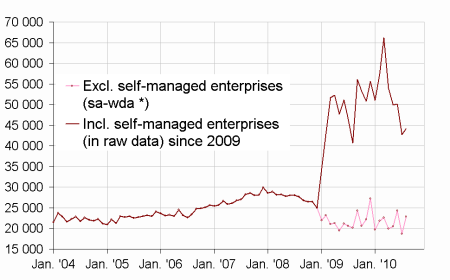
- * Seasonally and working-day adjusted data
- Source: INSEE (Sirene)
Pour en savoir plus
Time series : Business demography
