


 10 September 2010
2010- n° 220The commodities prices continued to rise in August Prices of oil and raw material imports - August 2010
10 September 2010
2010- n° 220The commodities prices continued to rise in August Prices of oil and raw material imports - August 2010
In August, the price of oil rose (+2.2%) and stood on aver-age at $ 77.0 per barrel. Meanwhile, the prices for non-energy commodities im-ported by France have continued to rise (+4.5% in foreign currencies, after +2.1% in July).
In August, the price of oil rose (+2.2%) and stood on average at $ 77.0 per barrel.
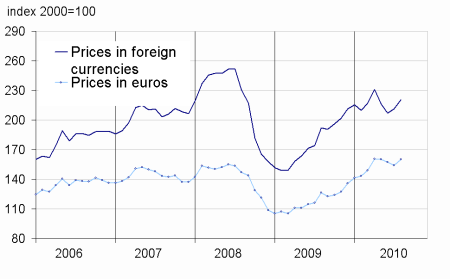
Meanwhile, the prices for non-energy commodities imported by France have continued to rise (+4.5% in foreign currencies, after +2.1% in July).
The price of oil rose again
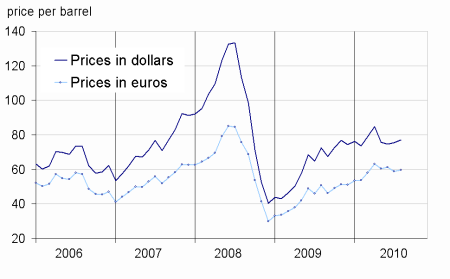
In August, the dollar price of oil from the North Sea (Brent) increased again (+2.2% after +0.9% in July). In euros, the increase of the price (+1.3% after –3.7% in July) was attenuated by the slight appreciation of euro vis-à-vis the dollar (+0.8 %).
The Prices of industrial raw materials acclerated
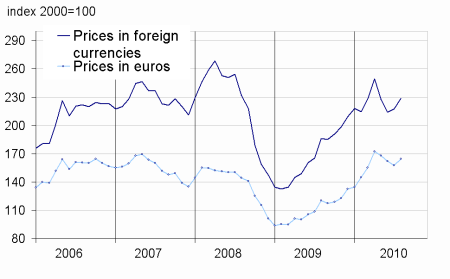
In August, the increase of the prices of industrial raw materials in foreign currencies rose (+5.0). The prices of mineral materials has risen again (+6.4%). The prices of nonferrous metals have all appreciated (+7.9%), particularly lead (+13.0%), zinc (+10.9%), nickel (+9.7%) and copper (+8.1%). Meanwhile, the precious metals prices rebounded , particularly, those of palladium (+7.6%, in line with fears of decline in production in South-Africa), silver (+2.2%) and glod (+1.9%).
The prices of agricultural raw materials also increased (+ 1.3%) due to the increase of the prices of natural rubber (+4.4%) and sawn timber tropical (+2.4%). The rebound in cotton prices (+7.5%) due to a sharp drop in production in China and Pakistan, fired up by the prices of natural fibers textiles (+6.3%).
The prices of raw food materials assessed
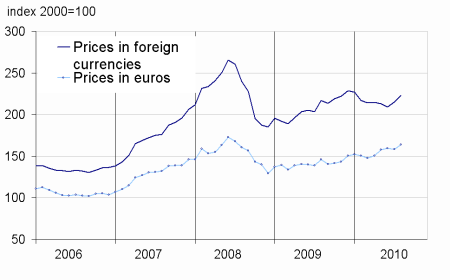
In August, the prices of raw food in foreign currencies rose again (+3.6% after +3.0% in July).The prices of oilseeds, vegetable oils have again increased appreciably (6.3% after +4.1%), includind palm oil (+11.6%), sunflower oil (+11.6%) and soybean meal (+5.5%). The prices of cereals also rose (4.8%) : the rise in the international wheat prices, a result of fires in Russia and poor harvest in some exporting countries, led to an increase in price for other cereals, and including maize (+9.0%). The prices of sugar continued to rise rapidly (+9.0% after +11.5% in July). In contrast, the prices of tropical betteraves were down (-4.3%) due to the higher production than expected in Côte d’Ivoire..
tableautabpetrole – Oil and petroleum products
| Prices | Change (%) | |||
|---|---|---|---|---|
| of last month | over the last month | over the last 3 months | over the last 12 months | |
| Brent in $ per barrel | 77.0 | 2.2 | 1.7 | 6.2 |
| Brent in € per barrel | 59.7 | 1.3 | –1.1 | 17.4 |
| Gasoline | 699.7 | 1.7 | –3.2 | 0.6 |
| Gas Oil | 651.2 | 2.0 | –0.3 | 9.4 |
| Heavy fuel | 424.0 | 4.9 | 1.0 | 3.3 |
| Naphta | 659.6 | 6.5 | –3.3 | 4.4 |
- Prices are in dollars per tonne unless otherwise specified
- Source : INSEE
tableautabmatprem – Imported raw materials (excluding energy) in domestic currency
| Index | Changes (%) | |||
|---|---|---|---|---|
| over last month | over the last 3 months | over the last 12 months | ||
| Food total | 223.1 | 3.6 | 4.8 | 3.0 |
| Tropical beverages | 243.1 | –0.8 | 5.5 | 9.0 |
| Oil seeds, vegetable oils | 242.9 | 6.3 | 9.6 | 1.1 |
| Cereals | 213.7 | 4.8 | 4.9 | –3.5 |
| Sugar | 235.9 | 9.0 | 31.6 | –11.5 |
| Beef meat | 138.1 | 3.3 | –8.5 | 11.2 |
| Industrial raw materials | 228.6 | 5.0 | 0.6 | 23.0 |
| Agricultural raw materials | 144.3 | 1.3 | –5.0 | 31.8 |
| Natural Fibers | 179.1 | 6.3 | 1.1 | 36.0 |
| Natural rubber | 392.5 | 4.4 | 3.8 | 44.6 |
| Hides | 114.4 | –1.2 | –0.8 | 25.4 |
| Wood pulp | 141.2 | –1.3 | 1.3 | 42.7 |
| Tropical wood | 148.2 | 2.4 | 6.8 | 14.4 |
| Sawn softwood | 85.4 | 2.2 | –19.4 | 14.2 |
| Minerals | 273.1 | 6.4 | 2.6 | 20.4 |
| Iron ore | 612.7 | 0.0 | 0.0 | 74.7 |
| Non-ferrous metals | 238.5 | 7.9 | 3.3 | 13.2 |
| Precious metals | 308.2 | 2.1 | –0.9 | 28.9 |
| All commodities | 220.8 | 4.5 | 2.0 | 15.0 |
- Source : INSEE
graphiqueG_petrole_ang – Oil
graphiqueG_alim_ang – Food
- Source : INSEE
graphiqueG_ensemble_ang – All commodities
- Source : INSEE
graphiqueG_indus_ang – Industrial raw materials
Pour en savoir plus
Time series : Raw materials prices
