


 13 August 2010
2010- n° 206French GDP increased in Q2 (+0,6%) Quarterly national accounts - second estimate - 2nd Quarter
13 August 2010
2010- n° 206French GDP increased in Q2 (+0,6%) Quarterly national accounts - second estimate - 2nd Quarter
French GDP increased in volume* by 0.6% in the second quarter of 2010, after +0.2% in the previous quarter.
French GDP increased in volume* by 0.6% in the second quarter of 2010, after +0.2% in the previous quarter.
Total GFCF bounced
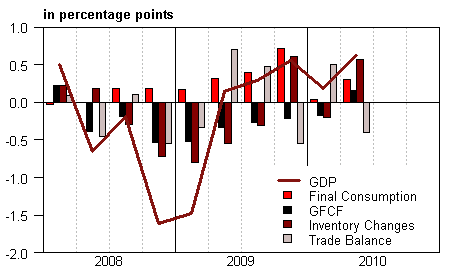
Production’s growth slightly increased (+0.7% after +0.3%). After eight quarters of contraction, total GFCF increased (+0.8% after –0.9%), whereas households’ consumption’s expenditures edged up (+0.4% after 0.0%). Altogether, total domestic demand (excluding inventory changes) positively contributed to GDP growth: +0.5 point after –0.1 point in the first quarter. Foreign trade balance deteriorated on the second quarter and negatively contributed to GDP growth (–0.4 point after +0.5 point): exports decelerated (+2.7% after +4.2%), however imports speeded up strongly (+4.2% after +1.8%). Inventory changes buoyantly contributed to activity’s soar: +0.6 point after –0.2 point. This mainly ensued from consumption and intermediate goods.
* This growth rate is seasonally and trading-day adjusted; volumes are chain-linked previous-year-prices volumes.
graphiqueGraph1 – GDP and its main components
tableauTab1 – GOODS AND SERVICES: RESOURCES AND USES CHAIN-LINKED VOLUMES
| 2009 Q3 | 2009 Q4 | 2010 Q1 | 2010 Q2 | 2009 | 2010 (ovhg) | |
|---|---|---|---|---|---|---|
| GDP | 0,3 | 0,6 | 0,2 | 0,6 | -2,5 | 1,2 |
| Imports | -0,1 | 2,8 | 1,8 | 4,2 | -10,6 | 6,3 |
| Households' consumption expenditure | 0,3 | 1,0 | 0,0 | 0,4 | 0,6 | 1,3 |
| General government's consumption expenditure | 0,8 | 0,6 | 0,1 | 0,3 | 2,8 | 1,4 |
| GFCF | -1,3 | -1,1 | -0,9 | 0,8 | -7,0 | -2,2 |
| of which Non financial corporated and unincorporated enterprises | -1,1 | -1,1 | -1,0 | 1,1 | -7,9 | -2,1 |
| Households | -1,8 | -1,5 | -0,5 | 0,1 | -8,7 | -2,9 |
| General government | -0,3 | 0,0 | -1,5 | 0,8 | 0,6 | -0,8 |
| Exports | 1,9 | 0,7 | 4,2 | 2,7 | -12,2 | 7,7 |
| Contributions : | ||||||
| Internal demand excluding inventory changes | 0,1 | 0,5 | -0,1 | 0,5 | -0,5 | 0,6 |
| Inventory changes | -0,3 | 0,6 | -0,2 | 0,6 | -1,8 | 0,4 |
| Net foreign trade | 0,5 | -0,5 | 0,5 | -0,4 | -0,2 | 0,2 |
Pour en savoir plus
Time series : Operations on goods and services
Time series : Gross domestic product balance
Time series : Institutional sector accounts
Time series : Branch accounts
