


 19 May 2010
2010- n° 131A decrease in enterprise births in April 2010 Enterprise births - April 2010
19 May 2010
2010- n° 131A decrease in enterprise births in April 2010 Enterprise births - April 2010
In April 2010, the number of enterprise births decreased compared to March (-18.1%).
Warning : From the August issue, only enterprise births data excluding self-managed enterprises (SME) are seasonally adjusted. In order to get the total of enterprise births, the raw number of SME is added. The SME time series is too short to be properly deseasonalized.
In April 2010, the number of enterprise births decreased compared to March (-18.1%).
+20.1% year-on-year (quarterly basis)
The amount of entries, added up February, March and April 2010, went up 20.1% compared to the same quarter one year before.
The sectors that most contributed to that raise were construction and service activities and construction.
+59.6% year-on-year (twelve months basis)
During the last twelve months, the number of births climbed by 59.6% year-on-year.
144,981 self-managed enterprises since the beginning of 2010
From January to April 2010, more than one out of two births enterprises were self-managed enterprises (144,981).
tableautab0EN – Self-managed entreprise births
| Jan. 2010 | Feb. 2010 | March 2010 | April 2010 |
|---|---|---|---|
| 31 342 | 35 550 | 43 595 | 34 494 |
- Source: INSEE (Sirene)
tableautab1EN – Enterprise births by month
| Jan. 2010 | Feb. 2010 | March 2010 | April 2010 | |
|---|---|---|---|---|
| Excl. self-managed enterprises (sa-wda *) | 19 693 | 21 843 | 22 706 | 19 788 |
| Variation [m-o-m] % | -27.7 | 10.9 | 4.0 | -12.8 |
| Incl. self-managed enterprises (in raw data) | 51 035 | 57 393 | 66 301 | 54 282 |
| Variation [m-o-m] % | -8.3 | 12.5 | 15.5 | -18.1 |
- * Seasonally and working-day adjusted data
- Source: INSEE (Sirene)
tableautab2EN – Enterprise births by type
| Moving total % change* | Moving total | Moving total | ||
|---|---|---|---|---|
| over 3 months | over 12 months | January- April 2010 | January- April 2009 | |
| Total | 20.1 | 59.6 | 239 528 | 191 383 |
| Companies | 8.3 | 2.6 | 58 589 | 53 571 |
| Individual enterprises | 24.3 | 95.9 | 180 939 | 137 812 |
| Of which self-managed | 39.8 | // | 144 981 | 93 832 |
- * Total of enterprises births during the last 3 or 12 months compared with the same months a year earlier
- // = meaningless
- Source: INSEE (Sirene)
graphiqueGraph1EN – Enterprise births
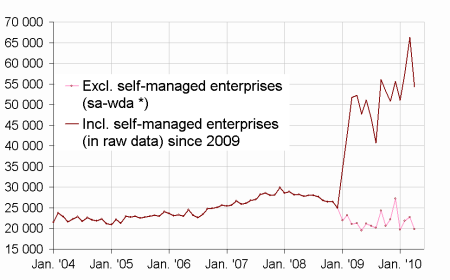
- * Seasonally and working-day adjusted data
- Source: INSEE (Sirene)
Pour en savoir plus
Time series : Business demography
