


 17 March 2010
2010- n° 72An increase in enterprise births in February 2010 Enterprise births - February 2010
17 March 2010
2010- n° 72An increase in enterprise births in February 2010 Enterprise births - February 2010
In February 2010, the number of enterprise births increased compared to January: +11.3% for enterprise births excluding self-managed enterprises (seasonally and working-day adjusted data); +12.9% when the number of self-managed enterprises (raw data) is added.
Warning : From the August issue, only enterprise births data excluding self-managed enterprises (SME) are seasonally adjusted. In order to get the total of enterprise births, the raw number of SME is added. The SME time series is too short to be properly deseasonalized.
In February 2010, the number of enterprise births increased compared to January: +11.3% for enterprise births excluding self-managed enterprises (seasonally and working-day adjusted data); +12.9% when the number of self-managed enterprises (raw data) is added.
+57.0% year-on-year (quarterly basis)
The amount of entries, added up December 2009, January 2010 and February 2010, went up 57.0% compared to the same quarter one year before.
The sectors that most contributed to that raise were service activities and household services.
+76.4% year-on-year (twelve months basis)
During the last twelve months, the number of births climbed by 76.4% year-on-year.
67,242 self-managed enterprises since the beginning of 2010
From January to February 2010, more than one out of two births enterprises were self-managed enterprises (67,242).
tableautab0EN – Self-managed entreprise births
| Nov. 2009 | Déc. 2009 | Jan. 2010 | Jév. 2010 |
|---|---|---|---|
| 28 615 | 28 413 | 31 440 | 35 802 |
- Source: INSEE (Sirene)
tableautab1EN – Enterprise births by month
| Nov. 2009 | Dec. 2009 | Jan. 2010 | Jan. 2010 | |
|---|---|---|---|---|
| Excl. self-managed enterprises (sa-wda *) | 22 194 | 27 221 | 19 717 | 21 946 |
| Variation [m-o-m] % | 7.8 | 22.7 | -27.6 | 11.3 |
| Incl. self-managed enterprises (in raw data) | 50 809 | 55 634 | 51 157 | 57 748 |
| Variation [m-o-m] % | -4.5 | 9.5 | -8.0 | 12.9 |
- * Seasonally and working-day adjusted data
- Source: INSEE (Sirene)
tableautab2EN – Enterprise births by type
| Moving total % change* | Moving total | Moving total | ||
|---|---|---|---|---|
| over 3 months | over 12 months | January 2010 | January 2009 | |
| Total | 57.0 | 76.4 | 113 178 | 81 197 |
| Companies | 12.9 | -1.4 | 28 396 | 26 258 |
| Individual enterprises | 83.0 | 140.3 | 84 782 | 54 939 |
| Of which self-managed | // | // | 67 242 | 32 146 |
- * Total of enterprises births during the last 3 or 12 months compared with the same months a year earlier
- // = meaningless.
- Source: INSEE (Sirene)
graphiqueGraph1EN – Enterprise births
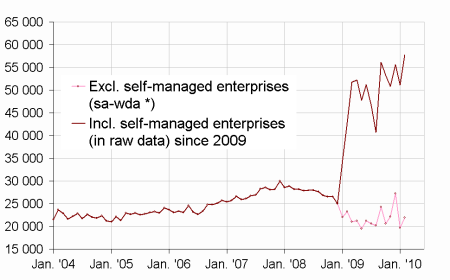
- * Seasonally and working-day adjusted data
- Source: INSEE (Sirene)
Pour en savoir plus
Time series : Business demography
