


 9 April 2010
2010- n° 99The prices of oil and raw materials rose in March Prices of oil and raw material imports - March 2010
9 April 2010
2010- n° 99The prices of oil and raw materials rose in March Prices of oil and raw material imports - March 2010
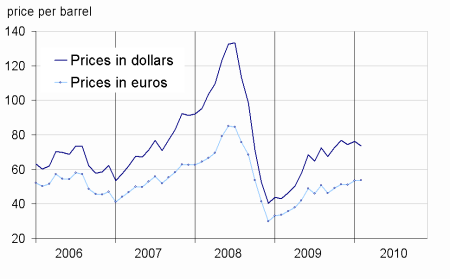
In March, oil prices reboundedl by 7.1% after falling 3.4% in February. The price of of oil stood at $78.8 a barrel, an in-crease of 69.0% compared to March 2009. Prices for non-energy commodities imported by France rebounded also (+3.3% after -2.6% in February).

In March, oil prices reboundedl by 7.1% after falling 3.4% in February. The price of of oil stood at $78.8 a barrel, an increase of 69.0% compared to March 2009. Prices for non-energy commodities imported by France rebounded also (+3.3% after -2.6% in February).
Oil prices increased again
In March, prices of oil from the North Sea (Brent) increased by 7.1% in dollars (after -3.4% in February), in connection with the rebound in demand in the Unites States. In euros, the price increased more strongly (+7.9%) as the euro depreciated by 0.7% vis-à-vis the U.S. dollar.
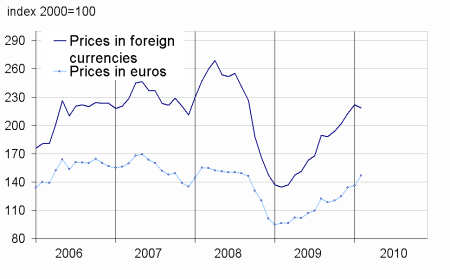
Prices of industrial materials rebounded
In March, prices of industrial raw materials in foreign currencies rose again (+6.0%). Their rise over one year thus amounted to 69.1%. The prices of minerals rose (+7.7%) : all the prices of non-ferrous metals increased (+8.7%), on top of which nickel (+18.4%) due to the miners’ strike in Canada.Precious metalsall appreciated (+4.0%), particularly silver (+7.8%) and palladium (+8.2%).
Prices of agro-industrial materials continued to increase (+1.6%), with the exception of sawn timber of conifers (-2.8%).
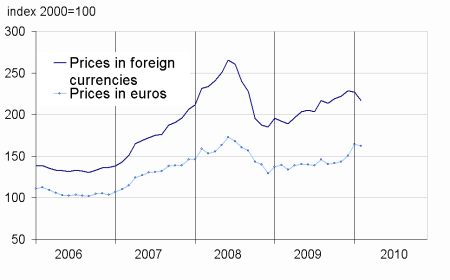
Raw food materials prices continued to decline
In March, prices of raw materials food in foreign currencies fell again (-1.4% after –4.3% in February). The biggest fall affected sugar (-27.6%), reflecting a better than expected production in India, tropical beverages (-3.9%, including 6.1% for cocoa) and cereals (-4.0% with –6.7% for rice). However, oilseedshad increased (+1.1%), including palm oil (+4.6%) and sunflower oil (+5.7%).
tableautabpetrole – Oil and petroleum products
| Prices | Change (%) | |||
|---|---|---|---|---|
| of last month | over the last month | over the last 3 months | over the last 12 months | |
| Brent in $ per barrel | 78,8 | 7,1 | 5,9 | 69,0 |
| Brent in € per barrel | 58,1 | 7,9 | 13,6 | 62,5 |
| Gasoline | 770,3 | 12,4 | 15,9 | 79,4 |
| Gas Oil | 669,5 | 8,8 | 9,9 | 64,3 |
| Heavy fuel | 434,8 | 1,9 | 2,7 | 94,3 |
| Naphta | 729,2 | 7,6 | 7,0 | 85,8 |
- Prices are in dollars per tonne unless otherwise specified
- Source: INSEE
tableautabmatprem – Imported raw materials (excluding energy) in domestic currency
| Index | Changes (%) | |||
|---|---|---|---|---|
| over last month | over the last 3 months | over the last 12 months | ||
| Food total | 214,0 | –1,4 | –6,5 | 13,4 |
| Tropical beverages | 223,8 | –3,9 | –14,0 | 14,9 |
| Oil seeds, vegetable oils | 226,9 | 1,1 | –5,0 | 12,4 |
| Cereals | 218,5 | –4,0 | –9,7 | –7,8 |
| Sugar | 236,5 | –27,6 | –22,6 | 49,0 |
| Beef meat | 140,5 | 8,4 | 16,6 | 14,1 |
| Industrial raw materials | 230,2 | 6,0 | 8,9 | 69,1 |
| Agricultural raw materials | 152,3 | 1,6 | 16,3 | 67,8 |
| Natural Fibers | 173,5 | 6,5 | 10,8 | 65,4 |
| Natural rubber | 426,6 | 2,8 | 12,1 | 106,0 |
| Hides | 104,6 | 7,2 | 10,7 | 142,5 |
| Wood pulp | 129,5 | 4,9 | 10,7 | 52,7 |
| Tropical wood | 131,5 | 1,2 | –0,6 | –2,9 |
| Sawn softwood | 108,4 | –2,8 | 26,7 | 80,3 |
| Minerals | 270,2 | 7,7 | 6,4 | 69,3 |
| Iron ore | 350,6 | 0,0 | 0,0 | 0,0 |
| Non-ferrous metals | 254,2 | 8,7 | 6,5 | 86,4 |
| Precious metals | 292,4 | 4,0 | 1,8 | 32,6 |
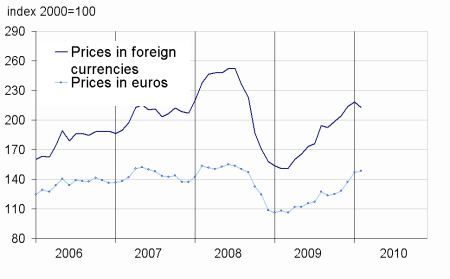
| All commodities | 218,7 | 3,3 | 2,8 | 45,3 |
- Source: INSEE
graphiqueG_petrole_ang – Oil
- Source: INSEE
graphiqueG_alim_ang – Food
- Source: INSEE
graphiqueG_ensemble_ang – All commodities
- Source: INSEE
graphiqueG_indus_ang – Industrial raw materials
- Source: INSEE
Pour en savoir plus
Time series : Raw materials prices
