


 8 January 2010
2010- n° 8The price of oil declined in December Prices of oil and raw material imports - December 2009
8 January 2010
2010- n° 8The price of oil declined in December Prices of oil and raw material imports - December 2009
In December, oil price fell by 2.9% after rising 5.4% in November. The price of barrel settled at $74.5 in December.
In December, oil price fell by 2.9% after rising 5.4% in November. The price of barrel settled at $74.5 in December.
Prices for non-energy commodities imported by France accelerated (+4.6% after 3.0% in November).
tableautabpetrole_ang – Oil and petroleum products
in dollar
| Prices | Change (%) | |||
|---|---|---|---|---|
| of last month | over the last month | over the last 3 months | over the last 12 months | |
| Brent in $ per barrel | 74,5 | –2,9 | 10,3 | 85,0 |
| Brent in € per barrel | 51,1 | –0,6 | 10,3 | 71,5 |
| Gasoline | 664,7 | –4,6 | 3,5 | 98,2 |
| Gas Oil | 609,0 | –2,4 | 9,5 | 34,1 |
| Heavy fuel | 423,5 | –7,1 | 7,4 | 103,2 |
| Naphta | 681,4 | 2,0 | 14,9 | 178,3 |
- Prices are in dollars per tonne unless otherwise specified
- Source : Insee
tableautabmatprem_ang – Imported raw materials (excluding energy) in domestic currency
base 100 in 2000
| Index | Changes (%) | |||
|---|---|---|---|---|
| over last month | over the last 3 months | over the last 12 months | ||
| Food total | 228,8 | 3,0 | 7,1 | 23,6 |
| Tropical beverages | 260,3 | 4,0 | 11,0 | 34,0 |
| Oil seeds, vegetable oils | 238,8 | 2,1 | 6,8 | 21,4 |
| Cereals | 242,0 | 6,9 | 10,8 | 9,2 |
| Sugar | 305,7 | 9,4 | 11,9 | 120,0 |
| Beef meat | 120,5 | –1,9 | –2,2 | –3,1 |
| Industrial raw materials | 213,0 | 5,5 | 13,6 | 44,1 |
| Agricultural raw materials | 132,0 | 6,0 | 20,1 | 36,7 |
| Natural Fibers | 156,7 | 5,6 | 17,3 | 39,8 |
| Natural rubber | 380,7 | 13,4 | 44,0 | 109,5 |
| Hides | 94,5 | 1,9 | 12,9 | 67,9 |
| Wood pulp | 119,4 | 4,8 | 15,1 | 22,8 |
| Tropical wood | 132,3 | –3,3 | 1,3 | –7,6 |
| Sawn softwood | 85,6 | 4,9 | 18,3 | 37,9 |
| Minerals | 255,8 | 5,4 | 11,7 | 45,2 |
| Iron ore | 350,6 | 0,0 | 0,0 | –28,2 |
| Non-ferrous metals | 238,7 | 6,4 | 13,2 | 71,4 |
| Precious metals | 330,1 | 1,7 | 14,1 | 63,3 |
| All commodities | 213,8 | 4,6 | 11,3 | 35,4 |
- source : Insee
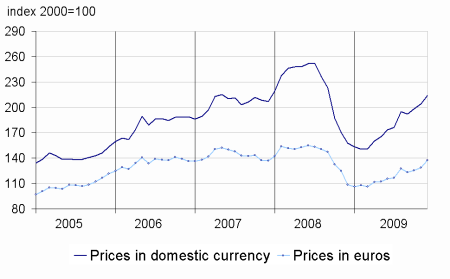
graphiqueG_alim_ang – Food
- Source : Insee
graphiqueG_petrole_ang – Oil
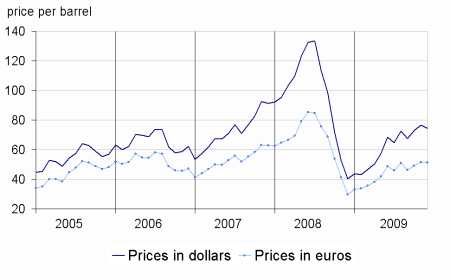
- Source : Insee
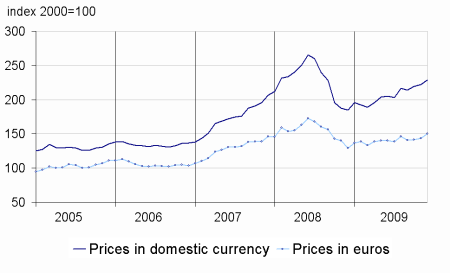
graphiqueG_ensemble_ang – All commodities
- Source : Insee
graphiqueG_indus_ang – Industrial raw materials
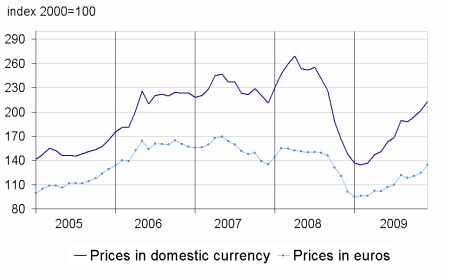
- Source : Insee
Pour en savoir plus
: bureau-de-presse@insee.fr
Time series : Raw materials prices
