


 8 December 2009
2009- n° 318Oil price continued to rise in November Prices of oil and raw material imports - November 2009
8 December 2009
2009- n° 318Oil price continued to rise in November Prices of oil and raw material imports - November 2009
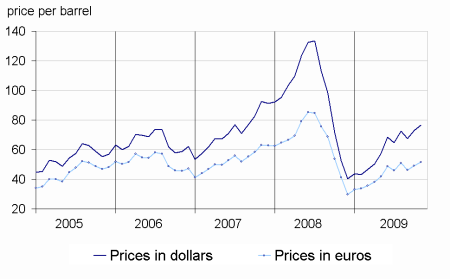
In November, oil price slowed down (+5.4% after +7.8% in October); it stood at $76.7. The rise of commodity prices excluding energy imported by France was also slightly lower (+2.7% after +3,2% in October).
In November, oil price slowed down (+5.4% after +7.8% in October); it stood at $76.7. The rise of commodity prices excluding energy imported by France was also slightly lower (+2.7% after +3,2% in October).
tableautabpetrole_ang – Oil and petroleum products
in dollar
| Prices | Change (%) | |||
|---|---|---|---|---|
| of last month | over the last month | over the last 3 months | over the last 12 months | |
| Brent in $ per barrel | 76,7 | 5,4 | 5,7 | 45,7 |
| Brent in € per barrel | 51,4 | 4,7 | 1,1 | 24,3 |
| Gasoline | 696,4 | 5,6 | 0,1 | 64,6 |
| Gas Oil | 623,6 | 1,8 | 4,7 | 5,6 |
| Heavy fuel | 455,8 | 10,2 | 11,0 | 122,1 |
| Naphta | 668,0 | 7,7 | 5,7 | 123,4 |
- Prices are in dollars per tonne unless otherwise specified
- Source : Insee
tableautabmatprem_ang – Imported raw materials (excluding energy) in domestic currency
base 100 in 2000
| Index | Changes (%) | |||
|---|---|---|---|---|
| over last month | over the last 3 months | over the last 12 months | ||
| Food total | 222,0 | 1,3 | 2,4 | 18,5 |
| Tropical beverages | 250,2 | –0,6 | 12,1 | 40,1 |
| Oil seeds, vegetable oils | 233,7 | 3,2 | –2,7 | 16,7 |
| Cereals | 226,4 | 2,7 | 2,2 | –7,2 |
| Sugar | 279,5 | –1,7 | 4,8 | 92,6 |
| Beef meat | 122,8 | 1,3 | –1,1 | –7,0 |
| Industrial raw materials | 201,1 | 3,6 | 6,1 | 21,1 |
| Agricultural raw materials | 122,4 | 5,2 | 10,4 | 10,5 |
| Natural Fibers | 148,3 | 5,3 | 12,7 | 34,1 |
| Natural rubber | 305,1 | –1,9 | 12,4 | 24,1 |
| Hides | 92,7 | 13,6 | 1,7 | –4,4 |
| Wood pulp | 113,9 | 4,2 | 15,1 | 4,9 |
| Tropical wood | 136,8 | 1,4 | 5,6 | –7,2 |
| Sawn softwood | 81,6 | 11,3 | 4,9 | 16,2 |
| Minerals | 242,8 | 3,1 | 4,8 | 23,4 |
| Iron ore | 350,6 | 0,0 | 0,0 | –28,2 |
| Non-ferrous metals | 224,3 | 3,2 | 4,5 | 36,8 |
| Precious metals | 324,6 | 6,8 | 18,9 | 67,0 |
| All commodities | 203,8 | 2,7 | 4,8 | 19,7 |
- source : Insee
graphiqueG_petrole_ang – Oil
- Source : Insee
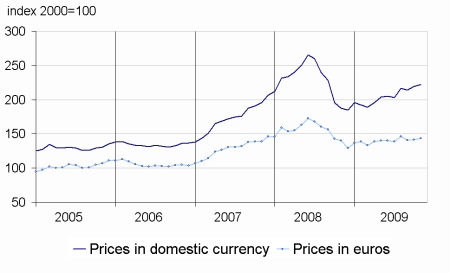
graphiqueG_alim_ang – Food
- Source : Insee
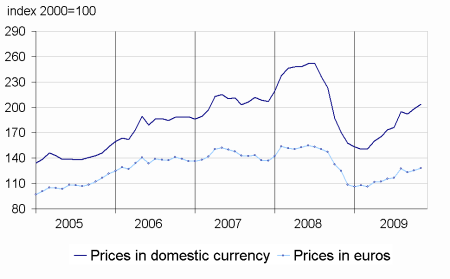
graphiqueG_ensemble_ang – All commodities
- Source : Insee
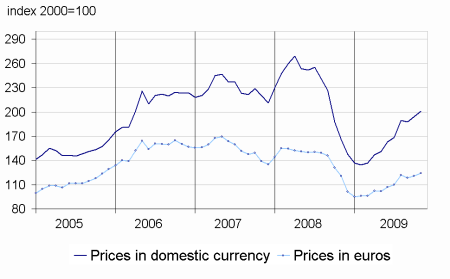
graphiqueG_indus_ang – Industrial raw materials
- Source : Insee
Pour en savoir plus
: bureau-de-presse@insee.fr
Time series : Raw materials prices
