


 17 November 2009
2009- n° 297Enterprise births remain at a high level in October 2009 Enterprise births - October 2009
17 November 2009
2009- n° 297Enterprise births remain at a high level in October 2009 Enterprise births - October 2009
Warning: From the current issue, only enterprise births excluding self-managed enterprises (SME) serie is seasonally adjusted. In order to get the total of enterprise births, the raw number of SME is added. The SME serie is too short to be properly deseasonalized.
Warning : From the current issue, only enterprise births excluding self-managed enterprises (SME) serie is seasonally adjusted. In order to get the total of enterprise births, the raw number of SME is added. The SME serie is too short to be properly deseasonalized.
In October 2009, the raw number of enterprise births increased by 5.3% compared to September. The seasonally and working-day adjusted number decreased by 4.9% (see the warning above).
+92.0% year-on-year (quarterly basis)
The amount of entries, added up August, September and October 2009, went up 92.0% compared to the same quarter one year before.
The sectors that most contributed to that raise were service activities and wholesale and retail trade.
+55.7% year-on-year (twelve months basis)
During the last twelve months, the number of births climbed by 55.7% year-on-year.
263,374 self-managed enterprises at the end of October 2009
From January to October 2009, more than one out of two births enterprises were self-managed enterprises (263,374).
tableauTableau 2 – Enterprise births from July to October
| July 2009 | August 2009 | Sept. 2009 | Oct. 2009 | |
|---|---|---|---|---|
| Excl. self-managed enterprises (sa-wda *) | 20 562 | 20 214 | 24 475 | 20 674 |
| Variation [m-o-m] % | -3.0 | -1.7 | 21.1 | -15.5 |
| Incl. self-managed enterprises (in raw data) | 46 555 | 40 715 | 56 352 | 53 590 |
| Variation [m-o-m] % | -9.1 | -12.5 | 38.4 | -4.9 |
- * Seasonally and working-day adjusted data
- Source : INSEE (Sirene).
tableauTableau 3 – Enterprise births by type
| Moving total % change* | Moving total | Moving total | ||
|---|---|---|---|---|
| on 3 months | on 12 months | January-October 2009 | January-October 2008 | |
| Total | 92.0 | 55.7 | 480 729 | 286 991 |
| Companies | -3.0 | -10.4 | 124 543 | 138 898 |
| Individual enterprises | 178.5 | 118.9 | 356 186 | 148 093 |
| Of which self-managed | // | // | 263 374 | // |
- * Total of enterprises births during the last 3 or 12 months compared with the same months a year earlier.
- // = meaningless.
- Source: INSEE (Sirene)
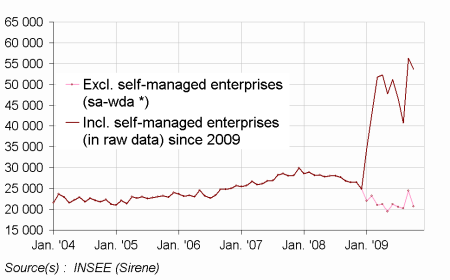
graphiqueGraph1EN – Enterprise births
Pour en savoir plus
Time series : Business demography
