


 14 August 2009
2009- n° 220Decline in payroll employment reduced in Q2 2009 Flash estimate of payroll employment - Second Quarter 2009
14 August 2009
2009- n° 220Decline in payroll employment reduced in Q2 2009 Flash estimate of payroll employment - Second Quarter 2009
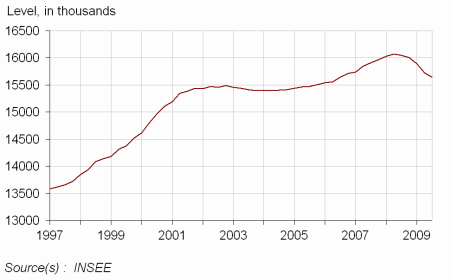
After a loss of 168,400 jobs during Q1 2009, payroll employment in principally market sectors continued to decline in Q2, but less markedly: -74,100. The reduction in the decline is mostly due to the stabilisation of temporary employment.
Payroll employment in principally market sectors down by 74,100 in Q2 2009
After a loss of 168,400 jobs during Q1 2009, payroll employment in principally market sectors continued to decline in Q2, but less markedly: -74,100. The reduction in the decline is mostly due to the stabilisation of temporary employment.
In the principally market sectors, employment decreased by 0.5% q-o-q and by 2.5% y-o-y.
graphiqueGraph1 – Payroll employment in principally market sectors
tableauTableau 1 – Payroll employment change in the competitive sector: thousands…
SA data in thousands
| Change in 3 months | Change in 1 year | Level | ||
|---|---|---|---|---|
| 2009 | 2009 | 2009 | ||
| Q1 | Q2 | Q2 | Q2 | |
| Total competitive sector (*) | -157.6 | na | na | na |
| Principally market sectors | -168.4 | -74.1 | -401.4 | 15647.0 |
| Goods-producing industries excl. Construction | -48.6 | -55.3 | -149.0 | 3503.1 |
| Manufacturing | -47.0 | -56.1 | -146.5 | 2724.9 |
| Construction | -8.7 | 3.6 | -8.1 | 1481.3 |
| Services | -111.2 | -22.4 | -244.3 | 10662.6 |
| of which: Temporary employment | -80.8 | -16.2 | -198.3 | 419.6 |
| Principally non-market sectors (*) | 10.7 | na | na | na |
- (*) Excl. Agriculture and public employees in non-market sectors (administration, health, education and social activity)
- na: not available
- Source: INSEE
tableauTableau 2 – … percentage
SA data in %
| Change in 3 months | Change in 1 year | ||
|---|---|---|---|
| 2009 | 2009 | ||
| Q1 | Q2 | Q2 | |
| Total competitive sector (*) | -0.9 | na | na |
| Principally market sectors | -1.1 | -0.5 | -2.5 |
| Goods-producing industries excl. Construction | -1.3 | -1.6 | -4.1 |
| Manufacturing | -1.7 | -2,0 | -5.1 |
| Construction | -0.6 | 0.2 | -0.5 |
| Services | -1.0 | -0.2 | -2.2 |
| of which: Temporary employment | -15.6 | -3.7 | -32.1 |
| Principally non-market sectors (*) | 0.5 | na | na |
- (*) Excl. Agriculture and public employees in non-market sectors (administration, health, education and social activity)
- na: not available
- Source: INSEE
Pour en savoir plus
: bureau-de-presse@insee.fr
