


 8 October 2009
2009- n° 261The prices of oil and raw materials declined in September Prices of oil and raw material imports - September 2009
8 October 2009
2009- n° 261The prices of oil and raw materials declined in September Prices of oil and raw material imports - September 2009
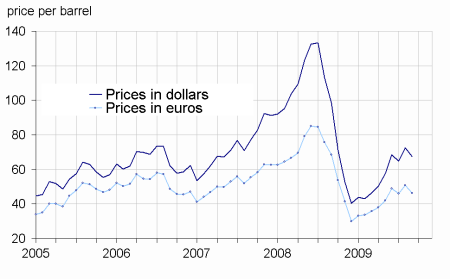
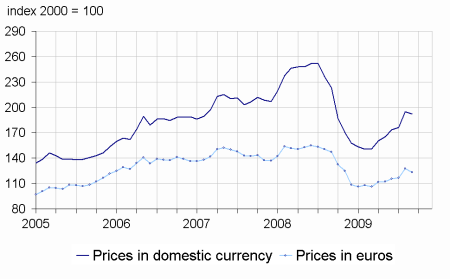
In september, the price of oil fell by 6.9% after rising 12.1% the previous month. The price of oil stood at $67.5. Prices of raw materials, excluding energy imported by France have also receded (-1.5% after 10.4% in August).
In september, the price of oil fell by 6.9% after rising 12.1% the previous month. The price of oil stood at $67.5. Prices of raw materials, excluding energy imported by France have also receded (-1.5% after 10.4% in August).
tableautabmatprem – Oil and petroleum productsImported raw materials (excluding energy) in domestic currency
in dollarbase 100 = 2000
| Prices* | Changes (%) | |||
| Of last month | Over the last month | Over the last 3 months | Over the last 12 months | |
|---|---|---|---|---|
| Brent in $ per barrel | 67,5 | -6,9 | -1,4 | -31,5 |
| Brent in € per barrel | 46,4 | -8,9 | -5,2 | -32,4 |
| Gasoline | 642,5 | -7,6 | -5,7 | -29,1 |
| Gas oil | 556,0 | -6,6 | -0,6 | -42,2 |
| Heavy fuel | 394,4 | -3,9 | 7,3 | -25,7 |
| Naphta | 593,0 | -6,2 | 5,3 | -31,1 |
| Indexes | Changes (%) | |||
| Over last month | Over the last 3 months | Over the last 12 months | ||
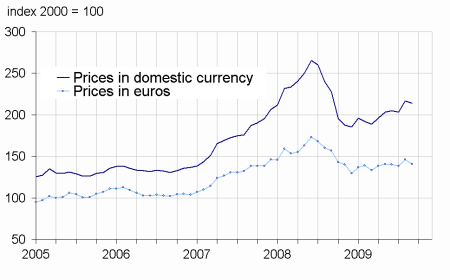
| Food total | 212,3 | -2,1 | 3,6 | -6,8 |
| Tropical beverages | 230,6 | 3,3 | 10,0 | 4,7 |
| Oil seeds, vegetables oils | 222,1 | -7,7 | -4,1 | -16,7 |
| Cereals | 219,8 | -0,7 | -5,7 | -26,5 |
| Sugar | 273,2 | 2,4 | 43,2 | 81,0 |
| Beef meat | 123,3 | -0,7 | 0,6 | -11,8 |
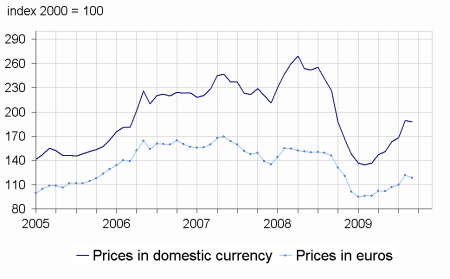
| Industrials raw materials | 187,5 | -1,1 | 15,0 | -17,3 |
| Agriculturals raw materials | 109,9 | -0,9 | 7,2 | -22,3 |
| Natural fibers | 133,5 | 1,4 | 7,1 | -10,5 |
| Natural rubber | 264,4 | -2,6 | 14,8 | -33,0 |
| Hides | 83,7 | -8,2 | 41,7 | -21,3 |
| Wood pulp | 103,7 | 4,8 | 15,4 | -18,2 |
| Sawn tropical wood | 130,6 | 0,8 | -5,1 | -12,8 |
| Sawn softwood | 72,4 | -7,0 | -3,5 | -24,7 |
| Minerals | 229,0 | -1,2 | 17,5 | -16,4 |
| Iron ore | 350,6 | 0,0 | 0,0 | -28,2 |
| Non-ferrous metals | 210,8 | -1,8 | 21,4 | -16,5 |
| Precious metals | 289,4 | 6,0 | 7,8 | 25,7 |
| All commodities | 191,8 | -1,5 | 10,6 | -14,0 |
- *Prices are in dollars per tonne unless otherwise specified.
- Source : Insee
- Source : Insee
graphiqueG_petrole – Oil
graphiqueG_alim – Food total
graphiqueG_ensemble – All commodities
graphiqueG_indus – Industrial raw materials
Pour en savoir plus
: bureau-de-presse@insee.fr
Time series : Raw materials prices
