

 14 March 2018
2018- n° 62New rise in business start-ups in February 2018 Enterprise births - February 2018
14 March 2018
2018- n° 62New rise in business start-ups in February 2018 Enterprise births - February 2018
In February 2018, the number of business births for all entreprises rose, but more slightly than in January (+0.5% after +2.7%, seasonally and working-day adjusted). Conventional businesses bounced back (+1.5% after −0.5%) and micro-entrepreneurs' registrations slipped back (−0.9% after +7.3%).
In February 2018, the number of business births for all entreprises rose, but more slightly than in January (+0.5% after +2.7%, seasonally and working-day adjusted). Conventional businesses bounced back (+1.5% after −0.5%) and micro-entrepreneurs' registrations slipped back (−0.9% after +7.3%).
graphiqueGraph1 – Monthly business start-ups (SA-WDA *)
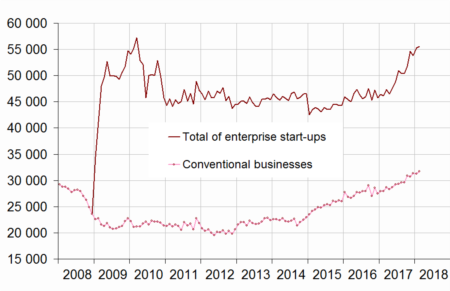
- * Seasonally and working-day adjusted data
- Source: INSEE, REE (Sirene)
tableauTable1 – Business set-ups by month (SA-WDA *)
| Nov. 2017 | Dec. 2017 | Jan. 2018 | Feb. 2018 | |
|---|---|---|---|---|
| Total businesses set-ups | 54,646 | 53,818 | 55,296 | 55,552 |
| Variation [m-o-m] % | 5.5 | -1.5 | 2.7 | 0.5 |
| Conventional businesses | 30,714 | 31,394 | 31,229 | 31,698 |
| Variation [m-o-m] % | -0.7 | 2.2 | -0.5 | 1.5 |
| Self-managed micro-entrepreneurs | 23,932 | 22,425 | 24,068 | 23,854 |
| Variation [m-o-m] % | 14.7 | -6.3 | 7.3 | -0.9 |
- * Seasonally and working-day adjusted data
- Source: INSEE, REE (Sirene)
+9.5% over the twelve last months
The raw number of business start-ups totted up during the last twelve months kept accelerating (+9.5% after +7.7% in January and +6.7% in December). All the types of business start-ups increased: micro-entrepreneurs' registrations (+13.2%), conventional sole proprietorship start-ups (+10.6%) and company births (+4.2%).
Upsurge of business setp-ups in business support activities over the twelve last months
In raw data over the twelve last months, business support activities was the sector that contributed the most to the overall rise (+16,200 business start-ups, which comes to a contribution of 3.5 points to the total)1. Within it, the increase was the higher in business and management counselling (+11,500 over the twelve last months).
More than two business set-ups out of five are self-managed micro-entrepreneurs' registrations
In February 2018, the share of micro–entrepreneurs' registrations in the businesses set up over the last twelve months increased for the fourth month in a row and reached 41.6%.
tableauTable0 – Business set-ups distribution by type
| Dec. 2017 | Jan. 2018 | Feb. 2018 | |
|---|---|---|---|
| Companies | 33.5 | 33.0 | 32.5 |
| Sole proprietorships excluding self-managed micro-entrepreneurs | 25.6 | 25.8 | 26.0 |
| Self-managed micro-entrepreneurs | 40.9 | 41.3 | 41.6 |
- Source: INSEE, REE (Sirene)

1 The contribution of a sector to the overall variation is the variation observed in this sector, weighted by the share of this sector in the total number of births.
tableauTable2 – Cumulated business start-ups by type
| Moving total % change * | Moving total | Moving total | ||
|---|---|---|---|---|
| over 3 months | over 12 months | January- February 2018 | January- February 2017 | |
| Total | 16.7 | 9.5 | 122,184 | 101,646 |
| Companies | 1.0 | 4.2 | 35,572 | 34,785 |
| Conventional sole proprietorships | 23.4 | 10.6 | 33,431 | 26,176 |
| Self-managed micro-entrepreneurs | 26.7 | 13.2 | 53,181 | 40,685 |
- * Total of business start-ups during the last 3 or 12 months compared with the same months a year earlier
- Source: INSEE, REE (Sirene)
Revisions
The variation in the overall number of business births in January 2018 has been lowered by 0.9 points to +2.7% due to the revision of raw data and the update of the SA-WDA parameters.
Business set-ups by economic activity
graphiqueGraph2 – Trade and business support activities monthly start-ups (SA-WDA *)
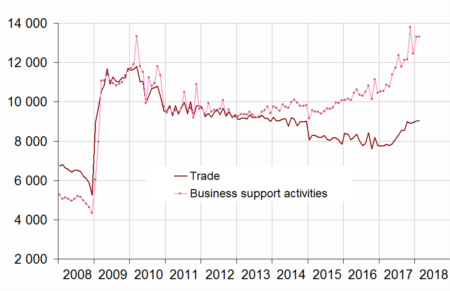
- * Seasonally and working-day adjusted data
- Source: INSEE, REE (Sirene)
graphiqueGraph3 – Construction and transportation business monthly set-ups (SA-WDA *)
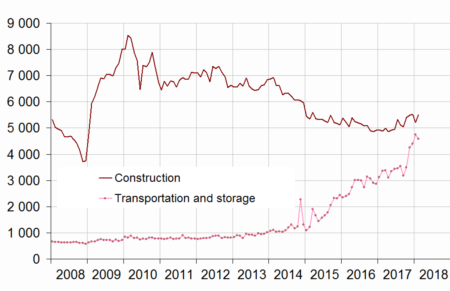
- * Seasonally and working-day adjusted data
- Source: INSEE, REE (Sirene)
tableauTable3 – Number of monthly business set-ups (incl. self-managed micro-entrepreneurs)
| NA | Dec. 2017 | Jan. 2018 | Feb. 2018 | |
|---|---|---|---|---|
| Total | 53,818 | 55,296 | 55,552 | |
| Industry | BE | 2,200 | 2,224 | 2,258 |
| Of which Manufacturing | C | 1,979 | 1,949 | 2,032 |
| Construction | FZ | 5,530 | 5,221 | 5,515 |
| Wholesale and retail trade, Transport, Accommodation and Food and beverage activities | GI | 16,119 | 16,466 | 16,442 |
| Trade | G | 8,955 | 9,021 | 9,015 |
| Transportation and storage | H | 4,395 | 4,741 | 4,587 |
| Accommodation and food service activities | I | 2,769 | 2,705 | 2,840 |
| Information and communication | JZ | 2,727 | 2,783 | 2,794 |
| Financial and insurance activities | KZ | 1,466 | 1,424 | 1,376 |
| Real estate activities | LZ | 2,031 | 2,094 | 2,073 |
| Business support activities | MN | 12,456 | 13,302 | 13,300 |
| Public administration and defence, education, human health and social work activities | OQ | 6,343 | 6,644 | 6,631 |
| Other services activities | RS | 4,946 | 5,139 | 5,164 |
- * Seasonally and working-day adjusted data
- Source: INSEE, REE (Sirene)
tableauTable4 – Fluctuation in the number of business set-ups (incl. self-managed micro-entrepreneurs)
| NA | Feb. 18 / Jan. 18 | Moving total % change** | ||
|---|---|---|---|---|
| SA-WDA * | over 3 months | over 12 months | ||
| Total | 0.5 | 16.7 | 9.5 | |
| Industry | BE | 1.5 | 5.9 | 2.9 |
| Of which Manufacturing | C | 4.2 | 11.2 | 4.8 |
| Construction | FZ | 5.6 | 9.0 | 1.7 |
| Wholesale and retail trade, Transport, Accommodation and Food and beverage activities | GI | -0.1 | 18.9 | 9.1 |
| Trade | G | -0.1 | 13.7 | 5.2 |
| Transportation and storage | H | -3.3 | 43.0 | 26.3 |
| Accommodation and food service activities | I | 5.0 | 3.0 | 1.4 |
| Information and communication | JZ | 0.4 | 17.4 | 10.9 |
| Financial and insurance activities | KZ | -3.4 | 4.0 | 4.2 |
| Real estate activities | LZ | -1.0 | 23.8 | 21.5 |
| Business support activities | MN | 0.0 | 20.6 | 15.2 |
| Public administration and defence, education, human health and social work activities | OQ | -0.2 | 9.3 | 4.9 |
| Other services activities | RS | 0.5 | 26.0 | 11.7 |
- * Seasonally and working-day adjusted data
- ** Total of business start-ups during the last 3 or 12 months compared with the same months a year earlier
- Source: INSEE, REE (Sirene)
Documentation
Note méthodologique_anglaise_ Février 2018 (pdf,29 Ko)
Pour en savoir plus
Time series : Business demography