

 22 December 2017
2017- n° 348In October 2017, services output bounced back (+1.4%) Index of services production - October 2017
22 December 2017
2017- n° 348In October 2017, services output bounced back (+1.4%) Index of services production - October 2017
In October 2017, output bounced back in services (+1.4%) after a decline in September (−0.6%).
- Services output increased strongly over the last three months
- Output also grew sharply over a year
- Rise in business support
- Sharp upturn in transportation and storage
- Rebound in information and communication
- Significant recovery in household services
- Rebound in accomodation and food service activities
- Revisions

The commentary shows variations of subsections by decreasing contribution to the overall variation. The contribution of a subsection depends on the extent of the change and on its weight.
In October 2017, output bounced back in services (+1.4%) after a decline in September (−0.6%).
Services output increased strongly over the last three months
Over the last three months (August to October), services production rose by 1.6% compared to the previous three months.
It grew in information and communication (+3.0%), business support (+1.0%), accomodation and food service activities (+2.6%), transportation and storage (+1.5%) and household services (+3.3%). By contrast, it decreased in real estate activities (−0.6%).
Output also grew sharply over a year
In services, output of the last three months rose sharply over a year (+5.1%), with an increase in all sectors.
Output went up strongly in business support (+5.3%), be it in administrative and business service activities (+7.0%) or in specialised, scientific and technical activities (+3.9%). It also grew sharply in information and communication (+6.2%), transportation and storage (+5.2%), accomodation and food service activities (+5.8%) and household services (+5.0%). It increased more modestly in real estate activities (+1.5%).
graphiqueGraph1 – Index of services production
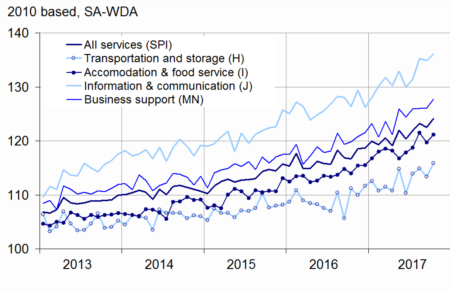
- Sources: DGFiP, INSEE
tableauTable1 – Variation in the services production
| Change in % | |||||
|---|---|---|---|---|---|
| Nace classification | Weight (1) | Oct./ Sept. | Sept./ Aug. | q-o-q (2) | y-o-y (3) |
| Index of services production | 10000 | 1.4 | –0.6 | 1.6 | 5.1 |
| H Transportation and storage | 1601 | 2.2 | –1.3 | 1.5 | 5.2 |
| I Accomodation and food service activities | 926 | 1.2 | –1.4 | 2.6 | 5.8 |
| J Information and communication | 1745 | 0.9 | –0.3 | 3.0 | 6.2 |
| L Real estate activities | 1064 | 0.9 | –1.1 | –0.6 | 1.5 |
| M+N Business support | 4020 | 1.3 | 0.0 | 1.0 | 5.3 |
| M Specialised, scientific and technical activities | 2210 | 1.3 | 0.0 | 0.5 | 3.9 |
| N Administrative and business service activities | 1810 | 1.2 | 0.1 | 1.4 | 7.0 |
| R+S Household services | 644 | 2.5 | –2.6 | 3.3 | 5.0 |
- (1) Weight (10 000 = H…S excepting K, O, P, Q)
- (2) Quarter-on-quarter: last three months / previous three months
- (3) Year-on-year: last three months / same three months of previous year
- Sources: DGFiP, INSEE
Rise in business support
In October 2017, after two steady months, output in business support activities edged up.
It increased in specialised, scientific and technical activities (+1.3%) after a stability in September, due to the rebound in architecture and engineering activities (+3.3%), activities of head offices and management consultancy (+1.2%) and advertising and market research (+4.4%).
Output also increased in administrative and business support activities (+1.2% after +0.1%). It grew in employment activities (+1.9%) and in services to building and landscape anctivities (+2.0%).
Sharp upturn in transportation and storage
In October 2017, output in transportation and storage recovered sharply (+2.2% after −1.3%). While it picked up in land transport (+2.5% after −2.3%) and in warehousing and support for transportation (+1.9% after −0.9%), it shrank in air transport (−3.0% after +3.1%).
Rebound in information and communication
After a slight decline in September (−0.3%), output in information and communication bounced back in October (+0.9%), primarily in telecommunications (+1.1%), information services (+2.9%) and motion picture, sound recording, music publishing (+2.4%).
Significant recovery in household services
Output in household services recovered sharply in October (+2.5% after −2.6%). It rallied strongly in the arts, entertainment and recreation sector (+4.6% after −4.1%) and more slightly in “other personal services” (+0.3% after −0.9%).
Rebound in accomodation and food service activities
Output in accomodation and food services picked up in October (+1.2% after −1.4%). It was more marked in accomodation (+2.9%, after −3.0%) than in food and beverage service activities (+0.7% after −1.0%).
Revisions
The month-on-month variation rate of the index of services production in September 2017 has been revised upwards by 0.1 points. Initially published at −0.7%, it has been stated at −0.6%.
tableauTable2 – Variation in the services production
| Change in % | |||||
|---|---|---|---|---|---|
| Weight (1) | Oct. 17 | Oct./ Sept. | Sept./ Aug. | q-o-q (2) | |
| Index of services production | 10000 | 124.2 | 1.4 | –0.6 | 1.6 |
| H transportation and storage | 1601 | 115.9 | 2.2 | –1.3 | 1.5 |
| 49 Land transport… | 686 | 118.8 | 2.5 | –2.3 | 1.5 |
| 50 Water transport | 63 | 237.8 | 4.5 | 1.0 | 22.1 |
| 51 Air transport | 129 | 98.9 | –3.0 | 3.1 | –1.7 |
| 52 Warehousing and support for transportation | 563 | 113.3 | 1.9 | –0.9 | –1.0 |
| 53 Postal and courier activities | 161 | 78.3 | 5.1 | –4.0 | –2.0 |
| I Accomodation and food service activities | 926 | 121.2 | 1.2 | –1.4 | 2.6 |
| 55 Accomodation | 211 | 111.7 | 2.9 | –3.0 | 1.8 |
| 56 Food and beverage service activities | 715 | 124.0 | 0.7 | –1.0 | 2.8 |
| J Information-communication | 1745 | 136.0 | 0.9 | –0.3 | 3.0 |
| 58 Publishing activities | 220 | 105.2 | 0.8 | –0.4 | 3.1 |
| 59 Motion picture, sound recording, music publishing | 124 | 121.7 | 2.4 | –0.9 | 0.3 |
| 60 Programming and broadcasting activities | 68 | 124.9 | 0.3 | 3.1 | 4.3 |
| 61 Telecommunications | 558 | 136.8 | 1.1 | –0.4 | 0.8 |
| 62 Computer programming... | 683 | 145.5 | 0.2 | –0.5 | 5.1 |
| 63 Information services | 92 | 162.3 | 2.9 | 0.7 | 2.9 |
| L Real estate activities | 1064 | 107.3 | 0.9 | –1.1 | –0.6 |
| M Specialised, scientific and technical activities | 2210 | 123.1 | 1.3 | 0.0 | 0.5 |
| 69 Legal and accounting activities | 496 | 121.1 | 1.0 | –0.5 | 0.1 |
| 70 Activities of head offices and management consultancy | 665 | 126.4 | 1.2 | –0.1 | 0.8 |
| 71 Architecture and engineering activities | 465 | 125.1 | 3.3 | –0.7 | 2.1 |
| 72 Scientific research and development | 313 | 104.0 | –2.3 | 2.8 | –2.2 |
| 73 Advertising and market research | 171 | 114.0 | 4.4 | –2.6 | –1.1 |
| 74 Other professional, scientific and technical activities | 71 | 194.0 | –0.3 | 2.3 | 3.1 |
| 75 Veterinary activities | 29 | 131.1 | 1.1 | –0.6 | 1.6 |
| N Administrative and business service activities | 1810 | 133.4 | 1.2 | 0.1 | 1.4 |
| 77 Rental and leasing activities | 545 | 130.7 | 0.1 | –0.7 | 1.6 |
| 78 Employment activities | 512 | 142.8 | 1.9 | 0.6 | 1.8 |
| 79 Travel agency, tour operator | 45 | 118.2 | 2.5 | –0.1 | 1.1 |
| 80 Security and investigation | 109 | 129.3 | 3.3 | –0.7 | –1.2 |
| 81 Services to building and landscape anctivities | 248 | 128.0 | 2.0 | 0.1 | 2.1 |
| 82 Other administrative and business support activities | 351 | 130.7 | 0.6 | 1.0 | 0.9 |
| R Arts, entertainment and recreation | 306 | 133.2 | 4.6 | –4.1 | 4.8 |
| S Other personal services | 338 | 112.8 | 0.3 | –0.9 | 1.8 |
- (1) Weight (10 000 = H…S excepting K, O, P, Q)
- (2) Quarter-on-quarter: last three months / previous three months
- Sources: DGFiP, INSEE
tableauTable3 – Revision of variations
| Sept./ Aug. | Aug./ Jul. | Jul./ Jun. | Q3 2017/ Q2 2017 | 2016/ 2015 | |
|---|---|---|---|---|---|
| Services production | 0.05 | –0.04 | 0.05 | 0.07 | –0.03 |
| Raw series | –0.09 | 0.07 | 0.01 | –0.11 | –0.03 |
| SA-WDA parameters | 0.14 | –0.11 | 0.04 | 0.18 | 0.00 |
- How to read: in the services industries, the SA-WDA variation in output between August 2017 and September 2017 is revised by +0.05 points: −0,09 points due to the revisions of raw data and +0,14 points due to the update of SA-WDA parameters.
- Sources: DGFiP, INSEE