

 18 September 2015
2015- n° 229In August 2015, business start-ups decreased again Enterprise births - August 2015
18 September 2015
2015- n° 229In August 2015, business start-ups decreased again Enterprise births - August 2015
In August 2015, the number of business births kept decreasing (–1.0% for all entreprises, seasonally and working-day adjusted). The number of other business start-ups declined for the first time since october 2014 (–2.0%). However self-managed micro-entrepreneurs' registrations picked up slightly (+0.5%).
In August 2015, the number of business births kept decreasing (–1.0% for all entreprises, seasonally and working-day adjusted). The number of other business start-ups declined for the first time since october 2014 (–2.0%). However self-managed micro-entrepreneurs' registrations picked up slightly (+0.5%).
–2.0% year-on-year (quarterly basis)
The raw amount of births added up in the last three months came down by 2.0% compared to the same months one year before, for all enterprises, of which –22.2% for self-managed micro-entrepreneurs alone. Construction and trade were the sectors that most contributed1 to that decrease.
–2.4% year-on-year (twelve months basis)
The raw number of business start-ups during the last twelve months decreased (–2.4% year-on-year). This was due to the downturn in self-managed micro-entrepreneurs' set-ups (–11.8%). Other enterprises' start-ups kept rising, included companies (+3.3%).
Hardly half of business set-ups are self-managed micro-entrepreneurs
In August 2015, 46.1% of business set-ups over the last twelve months were micro–entrepreneurs' registrations.
tableautab0EN – Business set-ups distribution by type
| June 2015 | July 2015 | Aug. 2015 | |
|---|---|---|---|
| Companies | 31.2 | 31.5 | 31.7 |
| Sole proprietorships excluding self-managed micro-entrepreneurs | 21.2 | 21.8 | 22.2 |
| Self-managed micro-entrepreneurs | 47.6 | 46.7 | 46.1 |
- Source: INSEE (Sirene)

1 The contribution of a sector to the overall variation is the observed variation of this sector, weighted by the share of this sector in the total number of births.
graphiqueGraph1EN – Business start-ups (sa-wda *)
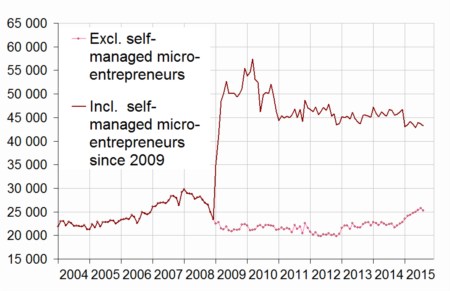
- * Seasonally and working-day adjusted data
- Source: INSEE (Sirene)
graphiqueGraph2EN – Trade and business support activities start-ups (sa-wda *)
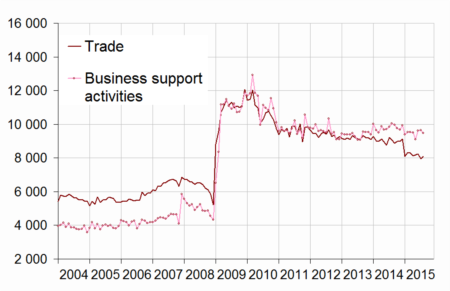
- * Seasonally and working-day adjusted data
- Source: INSEE (Sirene)
graphiqueGraph3EN – Construction and real estate business start-ups (sa-wda *)
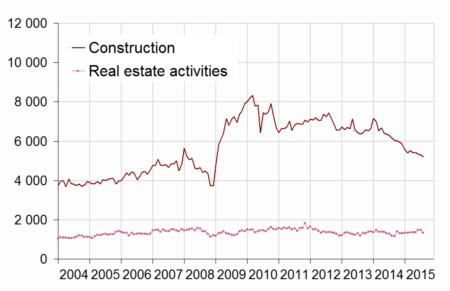
- * Seasonally and working-day adjusted data
- Source: INSEE (Sirene)
tableautab1EN – Business set-ups by month (sa-wda *)
| May 2015 | June 2015 | July 2015 | Aug. 2015 | |
|---|---|---|---|---|
| Excl. self-managed micro-entrepreneurs | 24,934 | 25,319 | 25,740 | 25,217 |
| Variation [m-o-m] % | 0.8 | 1.5 | 1.7 | -2.0 |
| Incl. self-managed micro-entrepreneurs | 42,795 | 43,966 | 43,660 | 43,232 |
| Variation [m-o-m] % | -1.7 | 2.7 | -0.7 | -1.0 |
- * Seasonally and working-day adjusted data
- Source: INSEE (Sirene)
tableautab2EN – Business start-ups by type
| Moving total % change * | Moving total | Moving total | ||
|---|---|---|---|---|
| over 3 months | over 12 months | January- August 2015 | January- August 2014 | |
| Total | -2.0 | -2.4 | 345,212 | 364,309 |
| Companies | 8.5 | 3.3 | 113,216 | 110,562 |
| Sole proprietorships | -6.7 | -4.8 | 231,996 | 253,747 |
| Of which self-managed micro-entrepreneurs | -22.2 | -11.8 | 145,959 | 184,340 |
- * Total of business start-ups during the last 3 or 12 months compared with the same months a year earlier
- Source: INSEE (Sirene)
tableautab3EN – Number of business set-ups (incl. self-managed micro-enterprises)
| NA | June 2015 | July 2015 | Aug. 2015 | |
|---|---|---|---|---|
| Total | 43,966 | 43,660 | 43,232 | |
| Industry | BE | 1,995 | 1,997 | 2,047 |
| Of which Manufacturing | C | 1,743 | 1,762 | 1,767 |
| Construction | FZ | 5,359 | 5,301 | 5,201 |
| Wholesale and retail trade, Transport, Accommodation and Food and beverage activities | GI | 12,123 | 11,983 | 12,110 |
| Of which Trade | G | 8,233 | 7,951 | 8,109 |
| Of which Transportation and storage | H | 1,583 | 1,578 | 1,392 |
| Of which Accommodation and food service activities | I | 2,348 | 2,390 | 2,392 |
| Information and communication | JZ | 2,138 | 2,072 | 2,083 |
| Financial and insurance activities | KZ | 1,320 | 1,328 | 1,167 |
| Real estate activities | LZ | 1,467 | 1,484 | 1,320 |
| Business support activities | MN | 9,622 | 9,658 | 9,479 |
| Public administration and defence, education, human health and social work activities | OQ | 5,678 | 5,826 | 5,717 |
| Other services activities | RS | 4,266 | 4,011 | 4,108 |
- * Seasonally and working-day adjusted data
- Source: INSEE (Sirene)
tableautab3bisEN – Fluctuation in the number of business set-ups (incl. self-managed micro-entrepreneurs)
| NA | Aug. 15 / July 15 | Moving total % change** | ||
|---|---|---|---|---|
| sa-wda * | over 3 months | over 12 months | ||
| Total | -1.0 | -2.0 | -2.4 | |
| Industry | BE | 2.5 | -13.8 | -9.6 |
| Of which Manufacturing | C | 0.3 | -17.1 | -10.4 |
| Construction | FZ | -1.9 | -13.3 | -14.2 |
| Wholesale and retail trade, Transport, Accommodation and Food and beverage activities | GI | 1.1 | -1.1 | -0.7 |
| Of which Trade | G | 2.0 | -6.2 | -6.5 |
| Of which Transportation and storage | H | -11.8 | 43.9 | 45.5 |
| Of which Accommodation and food service activities | I | 0.1 | -3.5 | 1.0 |
| Information and communication | JZ | 0.5 | -2.5 | -0.4 |
| Financial and insurance activities | KZ | -12.1 | 13.5 | 12.9 |
| Real estate activities | LZ | -11.1 | 17.2 | 0.5 |
| Business support activities | MN | -1.8 | -0.3 | -0.3 |
| Public administration and defence, education, human health and social work activities | OQ | -1.9 | 6.4 | 5.9 |
| Other services activities | RS | 2.4 | -6.2 | -5.9 |
- * Seasonally and working-day adjusted data
- ** Total of business start-ups during the last 3 or 12 months compared with the same months a year earlier
- Source: INSEE (Sirene)
Pour en savoir plus
Time series : Business demography