

 14 May 2020
2020- n° 119In Q1 2020, the labour market to the test of the health crisis ILO Unemployment and Labour Market-related indicators (Labour Force Survey results)
- first quarter 2020
14 May 2020
2020- n° 119In Q1 2020, the labour market to the test of the health crisis ILO Unemployment and Labour Market-related indicators (Labour Force Survey results)
- first quarter 2020
In Q1 2020, the number of ILO unemployed people decreased by 94,000 to 2.3 million people. The ILO unemployment rate thus fell by 0.3 points in the quarter to 7.8% of the labour force in France excluding Mayotte, after -0.3 points in the previous quarter. It was 0.9 points lower than its level one year earlier. In metropolitan France, it stood at 7.6%. The unemployment rate decreased for all age groups, and more strongly for men (-0.5 points) than for women (-0.1 points).
The fall in the unemployment rate resulted of a sharp fall in the number of jobless persons declaring themselves available or actively looking for work during the period of lockdown. The confinement period indeed strongly affected both active job search behaviour (for unemployed persons whose preferred sector of activity is at a standstill, for example), and availability of persons (childcare constraint, for example). Overall, ILO unemployment was therefore lower during this period of confinement, but this result did not reflect an improvement in the labour market. For more information, see the background note associated with this publication on the period of confinement (internet link 1, in French).
In fact, an ILO unemployed person is a person aged 15 or over who meets the three following criteria: is unemployed during the reference week; is available for work in the next two weeks; has been actively looking for work in the last four weeks or has found a job starting within three months. Based on the observations over the first 11 weeks of the quarter, the effect of the confinement on the average unemployment rate in the first quarter was estimated at -0.4 percentage points. In other words, the unemployment rate that would have been observed in the first quarter in the absence of the confinement would have been virtually stable at 8.2%.

This publication, released quarterly, presents the results of the Labour Force survey for the latest quarter. It does not, as such, aim to analyse the effect of the health crisis and containment on the labour market. Indeed, all the indicators presented are calculated on average over the quarter. Thus they are only partially affected by the generalized lockdown that took place mid-March, and which concerns around 2 weeks out of 13. A note on the impacts of the health crisis on the labour market is associated with this publication (in French). It presents in detail the results of the Labour Force survey for the last weeks of March.
The Labour Force survey for the first quarter of 2020 is doubly affected by the health crisis:
At the end of the quarter, the situation of people on the labour market was strongly affected by containment. The generalized lockdown began on Tuesday 17 March, during the 12th week of reference, out of the 13 that make up the quarter. As the activity indicators in the ILO sense are constructed from information relating to different reference periods, the impacts on these indicators may have been gradual, but for the most part they relate to the last two weeks of the quarter. A note on the effects of the health crisis on the labour market is associated with this publication (in French). It presents in detail the results of the Labour Force survey for the last weeks of March.
The collection of the survey had to be adapted. Instead of the usual face-to-face interviews, the first and last questions had to be conducted by telephone. As households are interviewed 6 times, the change in protocol only affected one third of the sample. Moreover, this change of protocol only concerned 4 out the 13 reference weeks of the quarter. These difficult collection conditions led to a decline in the collection rate at the end of the quarter (see chart). The usual adjustment methods make it possible to obtain data that remain representative of the entire population. The methodological note associated with this publication (web link 2, in English) provides additional information on these points. However, in line with Eurostat recommendations, the survey questionnaire has not been modified in order to be able to compare the indicators over time with unchanged concepts and methods.
- A trompe l'oeil decline in ILO unemployment
- Long-term unemployment decreased by 0.2 points over the quarter
- The halo of unemployment increased again in Q1 2020
- The employment rate was stable in Q1 2020
- Underemployment jumped to a record level
- Full-time employment rate advanced again
- The activity rate slightly declined in Q1 2020
- Revisions
- For more information
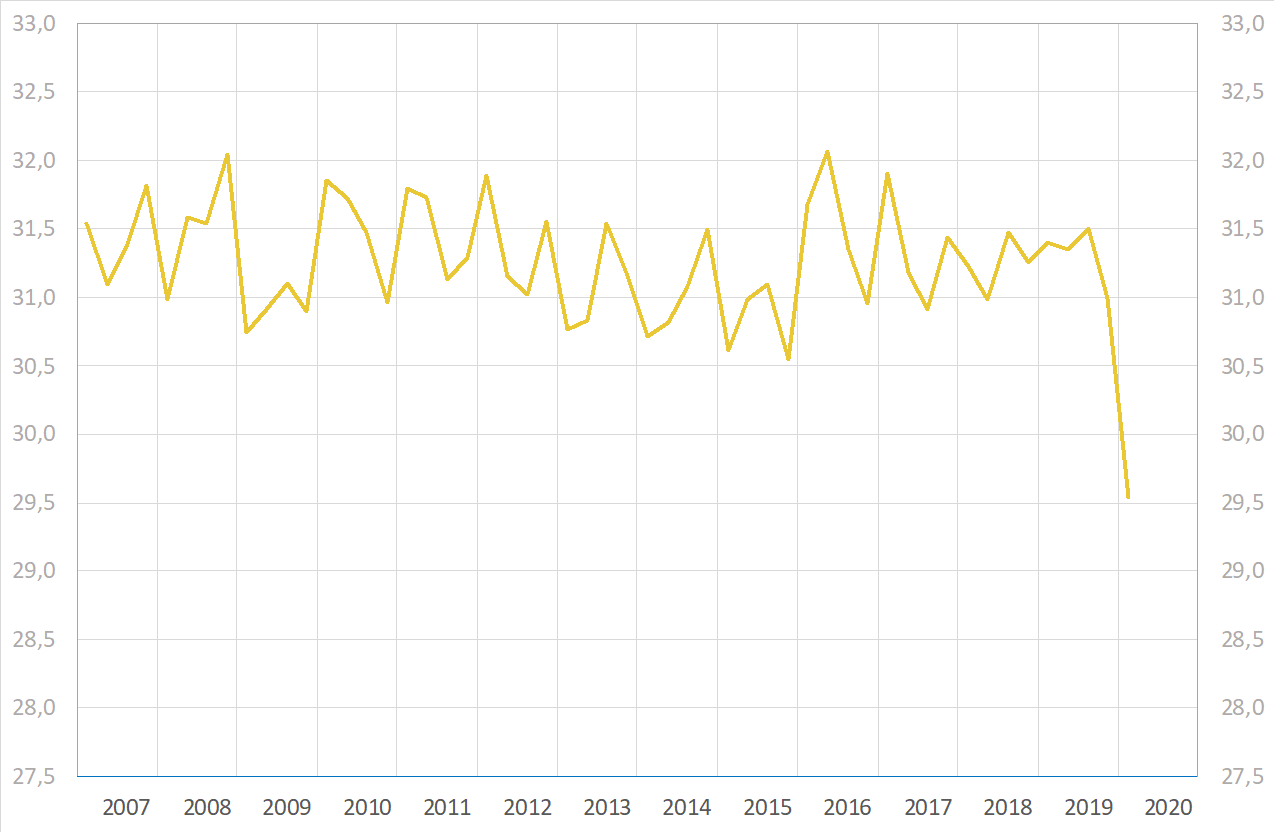
A trompe l'oeil decline in ILO unemployment
In Q1 2020, the number of ILO unemployed people decreased by 94,000 to 2.3 million people. The ILO unemployment rate thus fell by 0.3 points in the quarter to 7.8% of the labour force in France excluding Mayotte, after -0.3 points in the previous quarter. It was 0.9 points lower than its level one year earlier. In metropolitan France, it stood at 7.6%. The unemployment rate decreased for all age groups, and more strongly for men (-0.5 points) than for women (-0.1 points).
The fall in the unemployment rate resulted of a sharp fall in the number of jobless persons declaring themselves available or actively looking for work during the period of lockdown. The confinement period indeed strongly affected both active job search behaviour (for unemployed persons whose preferred sector of activity is at a standstill, for example), and availability of persons (childcare constraint, for example). Overall, ILO unemployment was therefore lower during this period of confinement, but this result did not reflect an improvement in the labour market. For more information, see the background note associated with this publication on the period of confinement (internet link 1, in French).
In fact, an ILO unemployed person is a person aged 15 or over who meets the three following criteria: is unemployed during the reference week; is available for work in the next two weeks; has been actively looking for work in the last four weeks or has found a job starting within three months. Based on the observations over the first 11 weeks of the quarter, the effect of the confinement on the average unemployment rate in the first quarter was estimated at -0.4 percentage points. In other words, the unemployment rate that would have been observed in the first quarter in the absence of the confinement would have been virtually stable at 8.2%.
tableauILO-unemployment rate
| France (excl. Mayotte) | Metropolitan France | |
|---|---|---|
| 2003-Q1 | 8.4 | 8.0 |
| 2003-Q2 | 8.5 | 8.1 |
| 2003-Q3 | 8.4 | 8.0 |
| 2003-Q4 | 8.8 | 8.4 |
| 2004-Q1 | 9.0 | 8.6 |
| 2004-Q2 | 8.8 | 8.4 |
| 2004-Q3 | 8.9 | 8.5 |
| 2004-Q4 | 8.9 | 8.5 |
| 2005-Q1 | 8.7 | 8.3 |
| 2005-Q2 | 8.8 | 8.4 |
| 2005-Q3 | 9.0 | 8.6 |
| 2005-Q4 | 9.0 | 8.7 |
| 2006-Q1 | 9.1 | 8.8 |
| 2006-Q2 | 9.0 | 8.6 |
| 2006-Q3 | 8.9 | 8.5 |
| 2006-Q4 | 8.4 | 8.0 |
| 2007-Q1 | 8.5 | 8.1 |
| 2007-Q2 | 8.1 | 7.8 |
| 2007-Q3 | 8.0 | 7.6 |
| 2007-Q4 | 7.5 | 7.1 |
| 2008-Q1 | 7.2 | 6.8 |
| 2008-Q2 | 7.3 | 7.0 |
| 2008-Q3 | 7.4 | 7.1 |
| 2008-Q4 | 7.7 | 7.4 |
| 2009-Q1 | 8.6 | 8.2 |
| 2009-Q2 | 9.2 | 8.8 |
| 2009-Q3 | 9.2 | 8.8 |
| 2009-Q4 | 9.5 | 9.1 |
| 2010-Q1 | 9.4 | 9.0 |
| 2010-Q2 | 9.3 | 8.9 |
| 2010-Q3 | 9.2 | 8.8 |
| 2010-Q4 | 9.2 | 8.8 |
| 2011-Q1 | 9.1 | 8.8 |
| 2011-Q2 | 9.1 | 8.7 |
| 2011-Q3 | 9.2 | 8.8 |
| 2011-Q4 | 9.4 | 9.0 |
| 2012-Q1 | 9.5 | 9.1 |
| 2012-Q2 | 9.7 | 9.3 |
| 2012-Q3 | 9.8 | 9.4 |
| 2012-Q4 | 10.1 | 9.7 |
| 2013-Q1 | 10.3 | 9.9 |
| 2013-Q2 | 10.5 | 10.1 |
| 2013-Q3 | 10.3 | 9.9 |
| 2013-Q4 | 10.1 | 9.8 |
| 2014-Q1 | 10.2 | 9.8 |
| 2014-Q2 | 10.2 | 9.8 |
| 2014-Q3 | 10.3 | 9.9 |
| 2014-Q4 | 10.4 | 10.1 |
| 2015-Q1 | 10.3 | 10.0 |
| 2015-Q2 | 10.5 | 10.2 |
| 2015-Q3 | 10.4 | 10.0 |
| 2015-Q4 | 10.2 | 9.9 |
| 2016-Q1 | 10.2 | 9.9 |
| 2016-Q2 | 10.0 | 9.7 |
| 2016-Q3 | 9.9 | 9.6 |
| 2016-Q4 | 10.0 | 9.7 |
| 2017-Q1 | 9.6 | 9.3 |
| 2017-Q2 | 9.5 | 9.2 |
| 2017-Q3 | 9.5 | 9.2 |
| 2017-Q4 | 9.0 | 8.6 |
| 2018-Q1 | 9.2 | 8.9 |
| 2018-Q2 | 9.1 | 8.8 |
| 2018-Q3 | 9.0 | 8.7 |
| 2018-Q4 | 8.7 | 8.4 |
| 2019-Q1 | 8.7 | 8.4 |
| 2019-Q2 | 8.4 | 8.2 |
| 2019-Q3 | 8.4 | 8.2 |
| 2019-Q4 | 8.1 | 7.8 |
| 2020-Q1 | 7.8 | 7.6 |
- Estimation within +/-0.3 point of the level of unemployment rate and of its quarterly variations.
graphiqueILO-unemployment rate

- Estimation within +/-0.3 point of the level of unemployment rate and of its quarterly variations.
- Scope: population of people living in households, people aged 15 years or more.
- Source: INSEE, Labour Force Survey.
Long-term unemployment decreased by 0.2 points over the quarter
Among the unemployed, 0.9 million declared that they had been seeking a job for at least one year. The long-term unemployment rate stood at 3.0% of the labour force in Q1 2020. It decreased by 0.2 points over a quarter and 0,5 points over a year.
tableauILO-unemployment rate
| ILO-unemployment rate (%) | Variation in points over | Thousands | |||
|---|---|---|---|---|---|
| 2019Q4 | 2020Q1 | quarter | year | 2020Q1 | |
| Unemployed persons | 8.1 | 7.8 | -0.3 | -0.9 | 2,314 |
| 15-24 years | 19.9 | 19.2 | -0.7 | -0.6 | 542 |
| 25-49 years | 7.4 | 7.2 | -0.2 | -0.8 | 1,281 |
| 50 years and more | 5.8 | 5.4 | -0.4 | -1.2 | 490 |
| Men | 8.2 | 7.7 | -0.5 | -1.0 | 1,175 |
| 15-24 years | 20.6 | 19.3 | -1.3 | -2.0 | 296 |
| 25-49 years | 7.2 | 6.9 | -0.3 | -0.8 | 632 |
| 50 years and more | 6.0 | 5.4 | -0.6 | -1.1 | 247 |
| Women | 8.0 | 7.9 | -0.1 | -0.8 | 1,139 |
| 15-24 years | 19.0 | 19.2 | 0.2 | 1.2 | 246 |
| 25-49 years | 7.6 | 7.5 | -0.1 | -0.8 | 649 |
| 50 years and more | 5.6 | 5.5 | -0.1 | -1.3 | 244 |
| Long-term unemployed persons | 3.2 | 3.0 | -0.2 | -0.5 | 896 |
- Scope : population of people living in households, people aged 15 years or more in France excluding Mayotte
- Source: INSEE, Labour Force Survey
The halo of unemployment increased again in Q1 2020
Among inactive people as defined by the ILO, 1.7 million persons wished to work without being considered as unemployed according to the ILO definition: they made up the halo of unemployment. Their number increased by 43,000 over a quarter, after a sharp rise in the previous quarter (+65,000). Thus the share of halo in the 15-64 years old population rose by 0.1 points quarter on quarter (+0.5 points year on year) ; to 4,1 %, its highest level since the the INSEE began measuring it in 2003.
As the main counterpart to the fall in unemployment, the confinement of the population led to a sharp increase in the halo at the end of the quarter. Its average effect over the quarter was estimated at +0.2 points for the population aged 15-64. In the absence of containment, the share of the population in the halo would thus have decreased by 0.1 points to 3,9 % in Q1 2020
tableauPeople in the halo of unemployment.
| Série Halo of unemployment (in thousands) (left scale) | Série Share of the population aged 15 to 64 years (in %) (right scale) | |
|---|---|---|
| 2003-Q1 | 1274 | 3.2 |
| 2003-Q2 | 1218 | 3.0 |
| 2003-Q3 | 1309 | 3.3 |
| 2003-Q4 | 1311 | 3.2 |
| 2004-Q1 | 1327 | 3.3 |
| 2004-Q2 | 1342 | 3.3 |
| 2004-Q3 | 1349 | 3.3 |
| 2004-Q4 | 1318 | 3.3 |
| 2005-Q1 | 1293 | 3.2 |
| 2005-Q2 | 1295 | 3.2 |
| 2005-Q3 | 1269 | 3.1 |
| 2005-Q4 | 1273 | 3.1 |
| 2006-Q1 | 1301 | 3.2 |
| 2006-Q2 | 1305 | 3.2 |
| 2006-Q3 | 1290 | 3.1 |
| 2006-Q4 | 1356 | 3.3 |
| 2007-Q1 | 1283 | 3.1 |
| 2007-Q2 | 1303 | 3.1 |
| 2007-Q3 | 1226 | 3.0 |
| 2007-Q4 | 1235 | 3.0 |
| 2008-Q1 | 1259 | 3.0 |
| 2008-Q2 | 1222 | 2.9 |
| 2008-Q3 | 1261 | 3.0 |
| 2008-Q4 | 1242 | 3.0 |
| 2009-Q1 | 1285 | 3.1 |
| 2009-Q2 | 1310 | 3.1 |
| 2009-Q3 | 1343 | 3.2 |
| 2009-Q4 | 1370 | 3.3 |
| 2010-Q1 | 1334 | 3.2 |
| 2010-Q2 | 1364 | 3.3 |
| 2010-Q3 | 1347 | 3.2 |
| 2010-Q4 | 1330 | 3.2 |
| 2011-Q1 | 1389 | 3.3 |
| 2011-Q2 | 1409 | 3.4 |
| 2011-Q3 | 1422 | 3.4 |
| 2011-Q4 | 1419 | 3.4 |
| 2012-Q1 | 1405 | 3.4 |
| 2012-Q2 | 1377 | 3.3 |
| 2012-Q3 | 1430 | 3.4 |
| 2012-Q4 | 1407 | 3.4 |
| 2013-Q1 | 1374 | 3.3 |
| 2013-Q2 | 1389 | 3.3 |
| 2013-Q3 | 1430 | 3.4 |
| 2013-Q4 | 1453 | 3.4 |
| 2014-Q1 | 1494 | 3.5 |
| 2014-Q2 | 1459 | 3.5 |
| 2014-Q3 | 1541 | 3.7 |
| 2014-Q4 | 1533 | 3.6 |
| 2015-Q1 | 1602 | 3.8 |
| 2015-Q2 | 1558 | 3.7 |
| 2015-Q3 | 1532 | 3.7 |
| 2015-Q4 | 1536 | 3.7 |
| 2016-Q1 | 1567 | 3.7 |
| 2016-Q2 | 1616 | 3.9 |
| 2016-Q3 | 1612 | 3.9 |
| 2016-Q4 | 1599 | 3.8 |
| 2017-Q1 | 1629 | 3.9 |
| 2017-Q2 | 1616 | 3.8 |
| 2017-Q3 | 1560 | 3.7 |
| 2017-Q4 | 1609 | 3.8 |
| 2018-Q1 | 1622 | 3.8 |
| 2018-Q2 | 1612 | 3.8 |
| 2018-Q3 | 1612 | 3.8 |
| 2018-Q4 | 1616 | 3.8 |
| 2019-Q1 | 1529 | 3.6 |
| 2019-Q2 | 1599 | 3.8 |
| 2019-Q3 | 1633 | 3.9 |
| 2019-Q4 | 1698 | 4.0 |
| 2020-Q1 | 1741 | 4.1 |
graphiquePeople in the halo of unemployment.
- Scope: population of people living in households in France excluding Mayotte, people aged 15 years or over.
- Source: INSEE, Labour Force Survey.
The employment rate was stable in Q1 2020
The employment rate of the population aged 15-64 years was stable at 66,0 % in Q1 after a 0.7 points increase at the end of 2019. Year on year, it rose by 0.5 points. It was stable among youths and virtually stable among people aged 25 to 49 and 50 to 64 (+0.1 points). This overall stability nevertheless reflects significant differences between men (+0.3 points) and women (-0.3 points).
The definition of employment in the Labour Force survey refers to the international criteria of the International Labour Office (ILO). Employment includes people who have worked at least one paid hour during a given period, but also people who have not worked for several reasons (paid leave, sick leave, short-time working... - in some cases, subject to conditions of duration). In this period of health crisis, a record number of employees find themselves in a situation of partial unemployment or sick leave or childcare leave. They are still considered as employed.
Underemployment jumped to a record level
As a result of the generalised containment that took place from mid-March, underemployment jumped by 2.7 points over the quarter, to 8.0% of employed people, an unprecedented level since the INSEE began measuring it in 1990. This increase directly results from the rise in the number of employed people in partial unemployment (+3.1 points on average over the quarter).
The increase in the share of underemployment affects both women (+2.0 points, to 9.8%) and men (+3.3 points to 6.4%).
Underemployment and partial unemployment are measured on average over the whole first quarter. Consequently, they only partly reflect their very strong increase at the end of the quarter. For more information on the effects of the health crisis on these indicators, please refer to the information note associated with this publication (in French).
tableauILO underemployment rate
| ILO underemployment rate | |
|---|---|
| 2003-Q1 | 4.8 |
| 2003-Q2 | 4.9 |
| 2003-Q3 | 5.0 |
| 2003-Q4 | 5.4 |
| 2004-Q1 | 5.3 |
| 2004-Q2 | 5.3 |
| 2004-Q3 | 5.4 |
| 2004-Q4 | 5.4 |
| 2005-Q1 | 5.5 |
| 2005-Q2 | 5.3 |
| 2005-Q3 | 5.3 |
| 2005-Q4 | 5.3 |
| 2006-Q1 | 5.2 |
| 2006-Q2 | 5.3 |
| 2006-Q3 | 5.6 |
| 2006-Q4 | 5.5 |
| 2007-Q1 | 5.6 |
| 2007-Q2 | 5.6 |
| 2007-Q3 | 5.7 |
| 2007-Q4 | 5.7 |
| 2008-Q1 | 5.3 |
| 2008-Q2 | 5.8 |
| 2008-Q3 | 5.8 |
| 2008-Q4 | 6.1 |
| 2009-Q1 | 6.5 |
| 2009-Q2 | 6.5 |
| 2009-Q3 | 6.6 |
| 2009-Q4 | 6.7 |
| 2010-Q1 | 7.3 |
| 2010-Q2 | 6.6 |
| 2010-Q3 | 6.6 |
| 2010-Q4 | 7.0 |
| 2011-Q1 | 5.6 |
| 2011-Q2 | 6.1 |
| 2011-Q3 | 6.3 |
| 2011-Q4 | 6.2 |
| 2012-Q1 | 6.2 |
| 2012-Q2 | 6.3 |
| 2012-Q3 | 6.2 |
| 2012-Q4 | 6.3 |
| 2013-Q1 | 7.1 |
| 2013-Q2 | 6.5 |
| 2013-Q3 | 6.6 |
| 2013-Q4 | 6.5 |
| 2014-Q1 | 6.5 |
| 2014-Q2 | 6.4 |
| 2014-Q3 | 6.5 |
| 2014-Q4 | 6.7 |
| 2015-Q1 | 6.7 |
| 2015-Q2 | 6.7 |
| 2015-Q3 | 6.8 |
| 2015-Q4 | 6.7 |
| 2016-Q1 | 6.5 |
| 2016-Q2 | 6.8 |
| 2016-Q3 | 6.4 |
| 2016-Q4 | 6.3 |
| 2017-Q1 | 6.3 |
| 2017-Q2 | 6.2 |
| 2017-Q3 | 6.3 |
| 2017-Q4 | 5.7 |
| 2018-Q1 | 6.2 |
| 2018-Q2 | 5.9 |
| 2018-Q3 | 5.7 |
| 2018-Q4 | 5.8 |
| 2019-Q1 | 5.3 |
| 2019-Q2 | 5.3 |
| 2019-Q3 | 5.4 |
| 2019-Q4 | 5.3 |
| 2020-Q1 | 8.0 |
graphiqueILO underemployment rate
- Scope: population of people living in households in France excludint Mayotte, people aged 15-64 years.
- Source: INSEE, Labour Force Survey
All in all, the share of labour market participants constrained in their labour supply by either a lack of employment (unemployed or in the halo around unemployment) or a situation of underemployment jumped by 2.1 points to 19.8%. It reached its highest level since the end of 2016.
graphiqueFrom unemployment to labour market supply constraint: shares among participants (employment, unemployment, halo) in the labour market

- Champ : France excluding Mayotte, people from households, aged 15 and over.
- Source : Insee, Labour Force survey.
The average number of hours worked per week fell by 4.7% over the quarter and 5.9% over a year, as a result of the sharp increase in end-of-quarter absences, mainly due to partial unemployment and sick leave or childcare leave.
graphiqueAverage number of worked hours per week
- Champ : metropolitan France, employed people from households, aged 15 to 64.
- Source : Insee, Labour Force survey.
Full-time employment rate advanced again
Full-time employment rate stood at 54.7% in Q1 2020. It increased by 0.3 points over a quarter and 0.8 points over a year. Part-time employment rate decreased by 0.3 points, to 11.3 %. It returned to the level reached mid-2019.
Permanent employment rate for people aged 15 to 64 stood at 49.5% in Q1 2020. It was virtually stable (+0,1 points) over the quarter, after a 0.3 points increase at the end of 2019. It increased by 0.2 points year on year. Fixed-term and temporary employment was almost stable (-0.1 points) compared to Q4 2019 and stable over a year. It stood at 7.6%, 0.5 points below its highest level reached at the end of 2017.
tableauILO employment rate in the population aged 15-64 years
| % of people in the age group | Variation in over | |||
|---|---|---|---|---|
| 2019Q4 | 2020Q1 | quarter | year | |
| Employed people | 66.0 | 66.0 | 0.0 | 0.5 |
| by sex | ||||
| Men | 69.1 | 69.4 | 0.3 | 0.6 |
| Women | 63.0 | 62.7 | -0.3 | 0.4 |
| by age | ||||
| 15-24 years | 29.5 | 29.5 | 0.0 | -0.3 |
| 25-49 years | 81.4 | 81.5 | 0.1 | 0.7 |
| 50-64 years | 63.4 | 63.5 | 0.1 | 1.1 |
| Included : 55-64 years | 54.0 | 54.0 | 0.0 | 1.3 |
| by type of employment contract | ||||
| Permanent employment | 49.4 | 49.5 | 0.1 | 0.2 |
| Fixed-term and temporary employment | 7.7 | 7.6 | -0,1 | 0.0 |
| Other types of employment | 8.9 | 8.9 | 0,0 | 0.3 |
| by contractual working time | ||||
| Full-time employment | 54.4 | 54.7 | 0.3 | 0.8 |
| Part-time employment | 11.6 | 11.3 | -0.3 | -0.3 |
| Full-time equivalent employment rate | 61.3 | 61.5 | 0.2 | 0.7 |
- Scope: population of people living in households in France excluding Mayotte, people aged 15-64 years
- Source: INSEE, Labour Force Survey
The activity rate slightly declined in Q1 2020
The activity rate of people aged 15-64 fell by 0.2 points over a quarter, to 71.7%, after a marked rise in the previous quarter (+0.4 points). It was virtually stable (–0.1 points) over a year. Quarter on quarter, the decrease was more pronounced among youths (-0.3 points), and persons aged 50 to 64 (-0.2 points), especially among those aged 55 to 64 (-0.4 points).
This average decline over the quarter is mainly explained by the shift from unemployment (labour force participation) to the halo around unemployment (inactivity) during the period of confinement at the end of the quarter.
tableauILO activity rate in the population aged 15-64 years
| % of people in the age group | Variation in points over | |||
|---|---|---|---|---|
| 2019Q4 | 2020Q1 | quarter | year | |
| Active people | 71.9 | 71.7 | -0.2 | -0.1 |
| by sex | ||||
| Men | 75.4 | 75.3 | -0.1 | -0.2 |
| Women | 68.5 | 68.2 | -0.3 | -0.1 |
| by age | ||||
| 15-24 years | 36.9 | 36.6 | -0.3 | -0.6 |
| 25-49 years | 87.9 | 87.8 | -0.1 | 0.0 |
| 50-64 years | 67.4 | 67.2 | -0.2 | 0.3 |
| Included : 55-64 years | 57.7 | 57.3 | -0.4 | 0.6 |
- Scope: population of people living in households in France excluding Mayotte, people aged 15-64 years
- Source: INSEE, Labour Force Survey
Revisions
Compared to the first estimate published on 13 February 2020, ILO unemployment rate in Q4 2019 was unchanged, at 8.1 %. One-time revisions of the unemployment rate limited to +/– 0.1 points for previous quarters are due both to weight revisions from 2016 onward period (calibration on new population margins) and the re-estimation of seasonal adjustment models.
For more information
An unemployed person according to the International Labour Office (ILO) is someone aged 15 or more who is not employed during the reference week, is available to work within two weeks and looked actively for a job in the previous month (or has found a job beginning in less than three months).
Next issue: 13 August 2020 at 07.30 am
Pour en savoir plus
