


 21 December 2018
2018- n° 341Households' purchasing power increased again in Q3 (+0.4% after +0.8%) Quarterly national accounts - detailed figures - third quarter 2018
21 December 2018
2018- n° 341Households' purchasing power increased again in Q3 (+0.4% after +0.8%) Quarterly national accounts - detailed figures - third quarter 2018
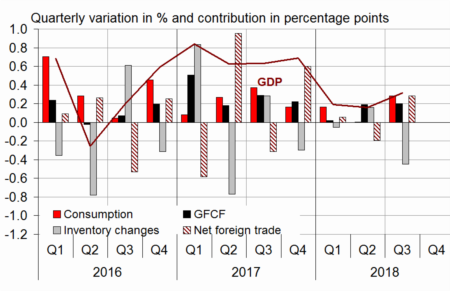
In Q3 2018, GDP in volume terms* accelerated slightly: +0.3% after +0.2%. Household consumption expenditures bounced back (+0.4% after −0.1%), whereas total gross fixed capital slightly sped up (GFCF: +0.9% after +0.8%). The final domestic demand excluding inventory rose. Its contribution to GDP growth sharply increased (+0.5 points after +0.2 points).
Imports fell back in Q3 (−0.6% after +0.6%), whereas exports increased (+0.3% after +0.0%). All in all, the foreign trade balance contributed positively to GDP growth: +0.3 points after −0.2 points in Q2. Conversely, inventory changes contributed negatively (−0.4 points after +0.2 points).

* This growth rate is seasonally and working-day adjusted; volumes are chain-linked previous-year-prices volumes.
graphiqueGraph – GDP and its main components
- Source: INSEE
tableauTab1 – GDP and its main components: chain-linked volumes
| 2017 Q4 | 2018 Q1 | 2018 Q2 | 2018 Q3 | 2017 | 2018 (ovhg) | |
|---|---|---|---|---|---|---|
| GDP | 0.7 | 0.2 | 0.2 | 0.3 | 2.3 | 1.5 |
| Imports | 0.2 | -0.6 | 0.6 | -0.6 | 4.1 | 0.7 |
| Household consumption *expenditure | 0.2 | 0.2 | -0.1 | 0.4 | 1.1 | 0.8 |
| General government's *consumption expenditure | 0.2 | 0.2 | 0.3 | 0.2 | 1.4 | 1.0 |
| GFCF | 1.0 | 0.1 | 0.8 | 0.9 | 4.7 | 2.8 |
| *of which Non-financial corporated and unincorporated enterprises | 1.3 | 0.1 | 1.3 | 1.5 | 4.4 | 3.7 |
| Households | 0.8 | 0.2 | 0.1 | -0.1 | 5.6 | 1.6 |
| General government | 0.2 | 0.0 | 0.6 | 0.0 | 1.6 | 0.8 |
| Exports | 2.2 | -0.4 | 0.0 | 0.3 | 4.7 | 2.6 |
| Contributions: | ||||||
| Internal demand excluding inventory changes | 0.4 | 0.2 | 0.2 | 0.5 | 2.0 | 1.3 |
| Inventory changes | -0.3 | -0.1 | 0.2 | -0.4 | 0.2 | -0.4 |
| Net foreign trade | 0.6 | 0.1 | -0.2 | 0.3 | 0.1 | 0.6 |
- Source: INSEE
tableauTab2 – Production, consumption and GFCF: main components
| 2017 Q4 | 2018 Q1 | 2018 Q2 | 2018 Q3 | 2017 | 2018 (ovhg) | |
|---|---|---|---|---|---|---|
| Production of branches | 0.9 | 0.1 | 0.3 | 0.6 | 2.6 | 1.9 |
| Goods | 1.1 | -0.6 | -0.3 | 0.6 | 2.2 | 0.9 |
| Manufactured Industry | 1.4 | -1.0 | -0.1 | 0.7 | 2.4 | 0.8 |
| Construction | 0.5 | -0.4 | 0.7 | 0.1 | 3.5 | 1.0 |
| Market services | 1.1 | 0.6 | 0.5 | 0.7 | 3.2 | 2.7 |
| Non-market services | 0.3 | 0.2 | 0.3 | 0.2 | 1.1 | 1.0 |
| Household consumption | 0.2 | 0.2 | -0.1 | 0.4 | 1.1 | 0.8 |
| Food products | 0.3 | -0.4 | -1.3 | 0.1 | 0.3 | -1.2 |
| Energy | -1.5 | 1.1 | -2.4 | 0.0 | 0.1 | -0.7 |
| Engineered goods | -0.1 | -0.3 | 1.0 | 0.7 | 2.6 | 1.5 |
| Services | 0.5 | 0.4 | 0.1 | 0.3 | 1.6 | 1.3 |
| GFCF | 1.0 | 0.1 | 0.8 | 0.9 | 4.7 | 2.8 |
| Manufactured goods | 1.7 | -1.3 | 1.4 | 2.1 | 3.7 | 3.0 |
| Construction | 0.3 | 0.0 | 0.7 | -0.3 | 3.5 | 1.3 |
| Market services | 1.4 | 1.0 | 0.8 | 1.5 | 7.0 | 4.5 |
- Source: INSEE
Purchasing power decelerated in Q3 2018
Households' gross disposable income (HDI) slowed down in current euros in Q3 2018 (+0.7% after +1.2%) in connection with the gross payroll growth deceleration (+0.5% after +0.7%). Furthermore, taxes on income and wealth decreased less than in the last quarter and social contributions rose slightly.
Households' consumption prices still grew at the same pace than the last quarter (+0.4%). Thus, purchasing power slowed down (+0.4% after +0.8%). Measured per consumption unit to refer to an individual level, it also decelerated (+0.3% after +0.7%).
In Q3 2018, volume of households' consumption increased at the same pace as purchasing power. As a result, the saving rate was virtually stable: it stood at 14.4% after 14.5% in Q2 2018.
tableauTab3 – Sectoral accounts
| 2017 Q4 | 2018 Q1 | 2018 Q2 | 2018 Q3 | 2017 | 2018 (ovhg) | |
|---|---|---|---|---|---|---|
| Profit ratio of NFCs* (level) | 32.1 | 32.1 | 31.7 | 31.9 | 32.0 | |
| Households' purchasing power | 0.3 | -0.5 | 0.8 | 0.4 | 1.4 | 0.9 |
- *NFCs: non-financial corporations
- Source: INSEE
tableauTab4 – Households' disposable income and ratios of households' account
| 2017 Q4 | 2018 Q1 | 2018 Q2 | 2018 Q3 | 2017 | 2018 (ovhg) | |
|---|---|---|---|---|---|---|
| HDI | 0.8 | 0.1 | 1.2 | 0.7 | 2.7 | 2.5 |
| Household purchasing power | 0.3 | -0.5 | 0.8 | 0.4 | 1.4 | 0.9 |
| HDI by cu* (purchasing power) | 0.2 | -0.6 | 0.7 | 0.3 | 0.9 | 0.5 |
| Adjusted HDI (purchasing power) | 0.3 | -0.3 | 0.7 | 0.4 | 1.5 | 1.0 |
| Saving rate (level) | 14.3 | 13.7 | 14.5 | 14.4 | 14.2 | |
| Financial saving rate (level) | 4.3 | 3.5 | 4.1 | 4.0 | 4.4 |
- *cu: consumption unit
- Source: INSEE
Non-financial corporations' profit rose slightly
In Q3 2018, non-financial corporations' profit ratio increased slightly to reach 31.9% (after 31.7%), sustained by productivity gains.
tableauTab5 – Ratios of non-financial corporations' account
| 2017 Q4 | 2018 Q1 | 2018 Q2 | 2018 Q3 | 2017 | |
|---|---|---|---|---|---|
| Profit share | 32.1 | 32.1 | 31.7 | 31.9 | 32.0 |
| Investment ratio | 23.6 | 23.6 | 23.9 | 24.2 | 23.5 |
| Savings ratio | 22.5 | 23.0 | 22.8 | 23.6 | 22.7 |
| Self-financing ratio | 95.4 | 97.7 | 95.7 | 97.7 | 96.6 |
- Source: INSEE
In Q3 2018, the public deficit increased again
In Q3 2018, general government net borrowing increased by 0.4 points: the public deficit stood at 3.1% of the GDP after 2.7%.
General government expenditure rose: +0.3% after −0.2%. They had declined sharply in the last quarter because of the decrease in repayments concerning the 3% tax on dividends, which stabilized this quarter.
Government receipts declined anew in Q3: −0.5% after −0.6%. Corporate tax revenues continued to decrease according to the cut of the corporate income tax rate for income up to 500,000€ and increase in refunds and rebates.
tableauTab6 – Expenditure, receipts and net borrowing of public administrations
| 2017 Q4 | 2018 Q1 | 2018 Q2 | 2018 Q3 | 2017 | |
|---|---|---|---|---|---|
| In billions of euros | |||||
| Total expenditure | 327.1 | 329.2 | 328.6 | 329.7 | 1294.3 |
| Total receipts | 314.4 | 314.9 | 312.9 | 311.4 | 1232.7 |
| Net lending (+) or borrowing (–) | -12.7 | -14.3 | -15.7 | -18.3 | -61.6 |
| In % of GDP | |||||
| Net lending (+) or borrowing (–) | -2.2 | -2.5 | -2.7 | -3.1 | -2.7 |
- Source: INSEE
Revisions
GDP growth estimate for Q3 2018 is revised at +0.3% (against +0.4% in second estimate). This revision is mainly due to the integration and revision of indicators and to the update of seasonal adjustment coefficients.
Pour en savoir plus
