


 19 December 2018
2018- n° 333In November, oil price plummeted Prices of oil and raw material imports - November 2018
19 December 2018
2018- n° 333In November, oil price plummeted Prices of oil and raw material imports - November 2018
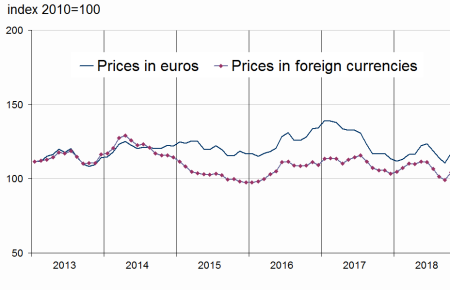
In November 2018, the price of oil in euros plummeted (−19.3% after +4.3% in october) while the prices in euros of imported commodities (excluding energy) held steady (0.0% after +4.9%). The prices of industrial raw materials fell back (−0.5% after +3.8%) and those of raw food materials eased (+0.6% after +6.2%).

Warning: Some data sets used up to now to compute the imported raw materials indices (excluding energy) are not published anymore by the World Bank, the main source for this data. This applies to sheep, rapeseed oil, and sunflower oil quotations. It has been replaced by similar data sets. Indices of oil seeds, meat, food, and all commodities may vary from previous issues.
In November 2018, the price of oil in euros plummeted (−19.3% after +4.3% in october) while the prices in euros of imported commodities (excluding energy) held steady (0.0% after +4.9%). The prices of industrial raw materials fell back (−0.5% after +3.8%) and those of raw food materials eased (+0.6% after +6.2%).
Oil price plummeted
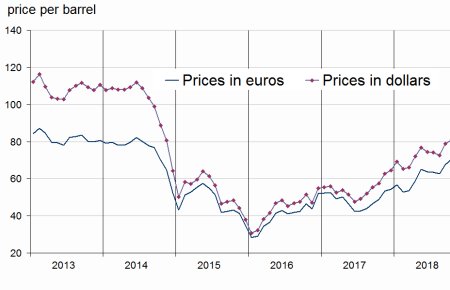
In November 2018, the price of North Sea crude oil (Brent) in euros plummeted (−19.3% after +4.3% in October) to an average of €57 per barrel. In dollars, the decrease was almost the same magnitude (−20.1% after +2.7%).
tableauTable1 – Oil and petroleum products
| Prices | Change (%) | |||
|---|---|---|---|---|
| of last month | over the last month | over the last 3 months | over the last 12 months | |
| Brent in $ per barrel | 64.7 | –20.1 | –10.7 | 3.2 |
| Brent in € per barrel | 57.0 | –19.3 | –9.3 | 6.6 |
| Gasoline cts €/L | 37.8 | –19.0 | –20.5 | –8.3 |
| Gas Oil | 554.1 | –11.9 | –2.9 | 16.1 |
| Heavy fuel | 381.0 | –11.4 | –1.7 | 18.1 |
| Naphtha | 461.1 | –21.8 | –16.6 | –5.4 |
- Prices are in euros per tonne unless otherwise specified
- Source : INSEE
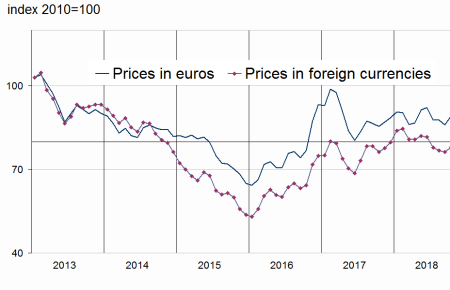
Industrial commodity prices slipped back
In November 2018, the prices in euros of industrial raw materials declined (−0.5% after +3.8% in september) as those of minerals (−0.8% after +5.5%), largely due to non-ferrous metals (−2.6% after +3.6%). The prices of ferous metals eased (+3.5% after +8.4) as those of precious metals +1.2% after +3.5%). The prices of agricultural raw materials recovered (+0.8% after −3.6%), mainly because of sawn softwood (+5.8% after −21.0%) and wood pulp (+1.2% after +1.4%). The price of tropical wood was virtually stable (+0.1% after +1.2%). However, the prices of natural fibres kept decreaseing (−1.0% after −1.7%). The price of hide fell back (−2.8% after +0.2%) as well as natural rubber (−5.8% after +0.8%).
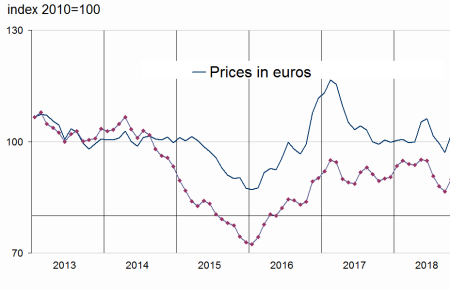
Food commodity prices increased slightly
In euros, the prices of raw food materials increased slightly (+0.6 % after +6.2%). The prices of meats increased slightly too (+1.6% after +10.1%), as those of tropical foodstuffs (+0.3% after +8.4%), seafood products (+0.6% after +4.4%) and oil seeds and vegetable oils (+0.8% after +0.6%). largely due to the price of sugar (+24.5% after +1.8%). The prices of cereals fell back anew (−1.3% after +4.0%) as well as sugar price (−2.0% after +24.5%).
tableauTable2 – Imported raw materials (excluding energy) in euros
| Index | Changes (%) | |||
|---|---|---|---|---|
| of last month | over the last month | over the last 3 months | over the last 12 months | |
| Food total | 118.0 | 0.6 | 3.4 | 0.8 |
| Tropical foodstuffs | 95.5 | 0.3 | 5.5 | –2.5 |
| Oil seeds, vegetable oils | 102.8 | 0.8 | –1.3 | –8.0 |
| Cereals | 97.5 | –1.3 | –0.7 | 8.0 |
| Sugar | 67.2 | –2.0 | 24.3 | –11.8 |
| Meat | 143.6 | 1.6 | 6.7 | 6.2 |
| Seafood products | 125.9 | 0.6 | 1.6 | 6.9 |
| Industrial raw materials | 88.9 | –0.5 | 1.4 | 2.1 |
| Agricultural raw materials | 120.0 | 0.8 | –6.7 | 3.6 |
| Natural Fibres | 106.4 | –1.0 | –6.4 | 13.2 |
| Natural rubber | 43.1 | –5.8 | –6.7 | –9.9 |
| Hides | 68.2 | –2.8 | –4.9 | –12.1 |
| Wood pulp | 154.0 | 1.2 | 1.4 | 32.6 |
| Tropical wood | 96.5 | 0.1 | 1.7 | 0.7 |
| Sawn softwood | 154.4 | 5.8 | –26.7 | –28.4 |
| Minerals | 82.9 | –0.8 | 3.4 | 1.8 |
| Ferrous metals | 60.8 | 1.2 | 10.5 | 18.5 |
| Non-ferrous metals | 99.8 | –2.6 | –1.7 | –6.8 |
| Precious metals | 102.9 | 1.2 | 2.8 | –4.7 |
| All commodities | 101.9 | 0.0 | 2.4 | 1.5 |
- Source : INSEE
graphiqueGraph1 – Oil (Brent)
graphiqueGraph3 – Food
- Source : INSEE
graphiqueGraph2 – Imported raw materials (excluding energy)
- Source : INSEE
graphiqueGraph4 – Industrial raw materials
- Source : INSEE
Pour en savoir plus
Time series : Raw materials prices
