


 30 November 2018
2018- n° 320In October 2018, agricultural prices increased by +4,2% over one year Indices of agricultural prices - October 2018
30 November 2018
2018- n° 320In October 2018, agricultural prices increased by +4,2% over one year Indices of agricultural prices - October 2018
In October 2018, agricultural producer prices slowed down over one year (+4.2% after +6.0% in September). Excluding fruit and vegetables, they went up by 4.1% over one year and by 0.3% over one month (after +1.0%).
In October 2018, agricultural producer prices slowed down over one year (+4.2% after +6.0% in September). Excluding fruit and vegetables, they went up by 4.1% over one year and by 0.3% over one month (after +1.0%).
New decline in cereal prices
In October 2018, cereal prices fell by 0.6% over one month (after −4.7%) and were still up sharply over one year (+23.3%). Soft wheat prices increased slightly (+0.3% over one month after −5.1%). Russian sales volumes weighed on prices again, but climate concerns over the level of global production remained strong. Grain maize prices lost 3.4% in October because of the abundance of supply from the Black Sea countries. Oilseed prices rebounded (+1.6% over one month after −2.4%) due to uncertainty on European rapeseed crop. (−0.6%).
graphiqueGraph1 – Producer prices of cereals
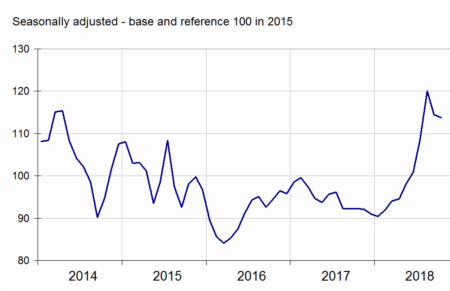
- Source: INSEE
Down prices over one year for fresh fruits, up for vegetables
In October 2018, fresh fruit prices fell by 3.0% over one year. Higher prices for apples (+2.6%) were more than offset by prices decline for pears (−5.1%) and grapes (−15.2%). Vegetable prices rose by 15.2% over one year with prices going up for salads (+15.6%), endives (+19.5%), carrots (+76.7%) and leeks (+54.2%). In contrast, tomato prices went down by 12.3% over one year.
graphiqueGraph2 – Producer prices of fresh vegetables
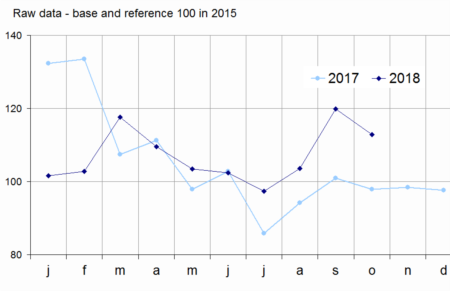
- Source: SSP (ministry in charge of agriculture)
Rising animal prices over a month
In October 2018, animal prices increased more moderately than in September (+0.6% after +1.3%). Prices for cattle were stable over one month, while those for pigs gained 3.6%. Over one year, however, these prices went down: −1.7% for cattle and −2.2% for pigs, due to a drop in demand and more intense competition between European countries.
graphiqueGraph3 – Producer prices of pigs and large cattle
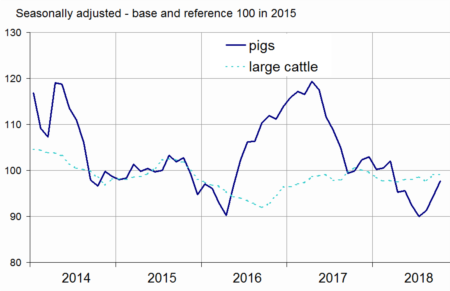
- Source: INSEE
Eggs and cow milk prices decreased over a year
In October 2018, egg prices declined by 27.2% over one year. By the end of 2017, French production was in high demand because of the fipronil crisis. Cow's milk prices dropped 0.6% over one year in September, after a near-stability in August.
tableautable1 – Index of producer prices of agricultural products (IPPAP)
| Variation as % over | |||||
|---|---|---|---|---|---|
| Weights | Oct. 2018 | a month | 3 months | a year | |
| Agricultural goods output | 1000 | 108.1 | /// | /// | +4.2 |
| excluding fruits and vegetables | 906 | 107.8 | +0.3 | +2.9 | +4.1 |
| Crop output (excluding fruits and vegetables) | 489 | 112.1 | 0.0 | +3.2 | +9.9 |
| Cereals | 152 | 113.8 | –0.6 | +4.9 | +23.3 |
| of which soft wheat | 90 | 117.0 | +0.3 | +4.9 | +27.2 |
| grain maize | 27 | 108.3 | –3.4 | +3.8 | +14.8 |
| Potatoes | 29 | 184.6 | /// | /// | +55.1 |
| Wines | 200 | 107.0 | +0.8 | –3.9 | –0.6 |
| PDO wines | 112 | 114.6 | +1.4 | –3.1 | –0.8 |
| other wines | 25 | 89.2 | –0.7 | –16.9 | –0.3 |
| Oleaginous | 40 | 94.9 | +1.6 | +3.3 | +1.4 |
| Horticultural products | 35 | 102.8 | +0.7 | +0.9 | –1.3 |
| Other crop products | 33 | 103.4 | –0.1 | +1.0 | –3.2 |
| Fruits and vegetables (1) | 94 | 110.3 | /// | /// | +5.4 |
| Fresh vegetables | 45 | 112.8 | /// | /// | +15.2 |
| Fresh fruits | 32 | 107.9 | /// | /// | –3.0 |
| Animal output | 417 | 102.8 | +0.7 | +2.5 | –2.6 |
| Animals | 255 | 98.9 | +0.6 | +1.5 | –1.1 |
| of which large cattle | 112 | 99.0 | 0.0 | +0.4 | –1.7 |
| calves | 20 | 100.0 | –1.6 | –2.1 | –0.9 |
| pigs | 49 | 97.7 | +3.6 | +8.6 | –2.2 |
| sheep | 14 | 97.2 | –1.3 | –5.4 | –1.6 |
| poultry | 57 | 98.8 | +0.5 | +1.5 | +0.3 |
| of which chicken | 39 | 98.9 | +0.2 | +1.6 | +0.5 |
| Milk | 146 | 107.6 | /// | +0.7 | –0.9 |
| of which cow milk (2) | 135 | 108.1 | /// | +0.7 | –1.0 |
| Eggs | 16 | 120.7 | +9.4 | +38.1 | –27.2 |
- /// Absence of meaning due to the nature of these series
- (1) Including vegetables for industry.
- (2) The September value of cow milk price index is the estimate of the October one. The previous month variation is the one commented in the text: −0,6 % over one year in September 2018.
- Sources: INSEE, SSP (ministry in charge of agriculture)
New rise in purchase prices of means of production over one month
In October 2018, intermediate consumption prices are increased again at a fast pace (+1.1% as in September), due to energy prices acceleration (+3.5% after +2.2%) and increases in animal feed prices (+1.0%) and fertilizers and amendments (+2.2%). Over one year, prices for intermediate consumption rose by 6.4%, in line with increases in energy prices (+20.9%) and those of fertilizers and amendments (+10.3%).
Prices of capital goods increased by 0.2% over one month and 3.5% over one year.year.
Revision
The variation over one year of IPPAP has been rosen by 0.3 points in September to +6.0%; The one of IPAMPA has not changed.
graphiqueGraph4 –
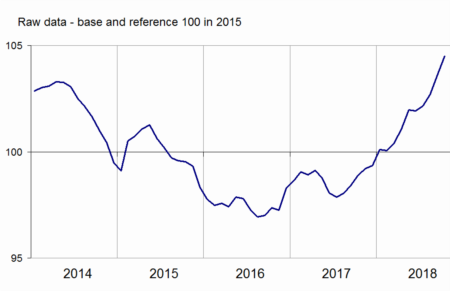
- Sources: INSEE, SSP (ministry in charge of agriculture)
tableautable2 – Indices of purchase prices of the means of agricultural production (IPAMPA)
| Variation as % over | |||||
|---|---|---|---|---|---|
| Weights | Oct. 2018 | a month | 3 months | a year | |
| Total input | 1000 | 104.5 | +0.9 | +2.3 | +5.7 |
| Intermediate consumptions | 760 | 103.6 | +1.1 | +2.9 | +6.4 |
| Energy | 93 | 125.7 | +3.5 | +6.5 | +20.9 |
| Seeds | 56 | 97.7 | –0.2 | +0.3 | +0.7 |
| Fertilisers and soil improvers | 107 | 94.3 | +2.2 | +6.8 | +10.3 |
| Plant protection products | 84 | 99.4 | –0.2 | –0.2 | +0.5 |
| Animal feed | 214 | 100.8 | +1.0 | +3.6 | +6.2 |
| Veterinary expenses | 37 | 107.3 | +0.4 | +0.5 | +1.8 |
| Small equipment and tools | 11 | 103.4 | +1.6 | +2.3 | +4.9 |
| Maintenance of materials | 88 | 105.3 | +0.3 | +0.6 | +2.6 |
| Maintenance of buildings | 9 | 105.5 | 0.0 | +0.3 | +2.2 |
| Other goods and services | 61 | 102.5 | 0.0 | –0.1 | +0.6 |
| Goods and services contributing to investment | 240 | 107.3 | +0.2 | +0.6 | +3.5 |
| Material | 168 | 107.0 | +0.3 | +1.1 | +3.3 |
| Tractors | 71 | 111.3 | +0.5 | +1.8 | +4.4 |
| Machinery and equipment for cultivation | 33 | 104.9 | 0.0 | 0.0 | +2.2 |
| Machinery and equipment for harvesting | 38 | 104.5 | +0.2 | +1.6 | +2.6 |
| Utility vehicles | 16 | 100.2 | +0.2 | +0.4 | +1.0 |
| Buildings | 72 | 108.2 | 0.0 | –0.6 | +3.9 |
- (1) The repayment of the domestic tax on energy product (TICPE) benefiting farmers has been applied in advance for the year 2018.
- Sources: INSEE, SSP (ministry in charge of agriculture)
Pour en savoir plus
Time series : Indices of agricultural prices
