


 22 November 2018
2018- n° 304In November 2018, the business climate is stable in services Monthly survey of services - November 2018
22 November 2018
2018- n° 304In November 2018, the business climate is stable in services Monthly survey of services - November 2018
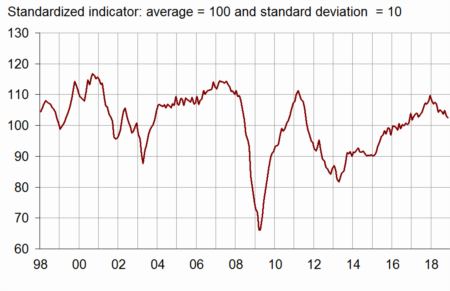
According to business managers surveyed in November 2018, the business climate in services is stable. At 103, it remains above its long-term average (100).
Otherwise, the indicator of October 2018 has been revised downward by two points because of late businesses' answers that have been taken into account.
- Activity prospects considered a little less positive
- In road transport, the business climate has weakened
- The business climate has improved in accommodation and food services
- The business climate remains at its average level in information and communication
- The business climate remains deteriorated in real estate activities
- In professional activities, the business climate has worsened
- The business climate has weakened in administrative and support service activities
According to business managers surveyed in November 2018, the business climate in services is stable. At 103, it remains above its long-term average (100).
Otherwise, the indicator of October 2018 has been revised downward by two points because of late businesses' answers that have been taken into account.
graphiqueGraph 1 – Business climate composite indicator
Considering this revision, the turning point indicator stands henceforth in the area indicating an unfavourable short-term economic situation.
graphiqueGraph 2 – Turning point indicator
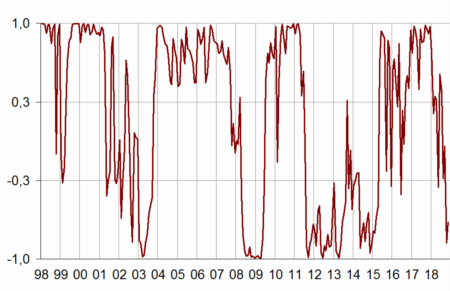
- Note: close to 1 (respectively –1), this indicator indicates a favourable short-term economic situation (respectively unfavourable). The uncertainty area is between –0.3 and +0.3.
Activity prospects considered a little less positive
The balances of opinion of business managers on their own activity prospects and on the general outlook for their whole sector have slightly decreased. In contrast, those on past activity and expected demand have bounced back. The balance on past activity stands just at its average; all the other balances are below their mean.
The balances on selling prices have kept on weakening and stand below their long-term average.
Likewise, the balances on past and on expected employment have decreased again and are below their average.
tableauTable 1 – Economic outlook in the services sector
| Average* | Aug. 18 | Sept. 18 | Oct. 18 | Nov. 18 | |
|---|---|---|---|---|---|
| Composite indicator | 100 | 104 | 105 | 103 | 103 |
| General outlook | –7 | –3 | –1 | 0 | –1 |
| Past activity | 2 | 1 | 2 | –1 | 2 |
| Expected activity | 2 | 4 | 6 | 4 | 3 |
| Expected demand | 0 | 5 | 6 | 2 | 4 |
| Past selling prices | –4 | –2 | –3 | –7 | –9 |
| Expected selling prices | –3 | 0 | –3 | –3 | –4 |
| Past employment | 3 | 3 | 3 | –2 | –4 |
| except temporary work agencies | 1 | 1 | 3 | 3 | 2 |
| Expected employment | 3 | 7 | 6 | 4 | 1 |
| except temporary work agencies | 0 | 5 | 4 | 5 | 2 |
| Investments | |||||
| Past investments | 2 | 8 | 10 | 6 | 7 |
| Expected investments | 2 | 4 | 6 | 2 | 0 |
- * Average since 1989 for the composite indicator and since 1988 for the balances of opinion
- Source: INSEE, monthly business survey in services.
The business climate stands above its long-term average in most sub-sectors; however, it remains equal to its average in information-communication and it remains very deteriorated in real estate activities. The climate has improved again in accommodation and food service activities. In contrast, it has worsened in road transport, in professional, scientific and technical activities and in administrative and support service activities.
In road transport, the business climate has weakened
The business climate indicator in road transport has lost one point. At 108, it stands however above its average level. All the balances of opinion have fallen back except that on expected activity, on the rise again. All the balances are above their average.
The business climate has improved in accommodation and food services
The business climate in accommodation and food services has gained three points. At 112, it has returned to its September level, significantly above its long-term average. This upturn is due to the sharp increase in the balances on past activity, on expected demand and on general outlook. All balances are above their average, except that on expected employment.
The business climate remains at its average level in information and communication
In information and communication, the business climate is stable at its average level (100). The decline in the balances on expected activity and on expected employment is offset by the increase in those on expected demand, on past activity, on past employment and on general outlook. The balance on general outlook has reached its average, those on employment are above their mean, the other balances are below it.
The business climate remains deteriorated in real estate activities
In real estate activities, the business climate is unchanged (89), clearly below its average. The sharp rise in the balance on past activity offsets the downturn in the balances on employment and on general outlook. All balances are below their long-term average, except that on expected demand.
In professional activities, the business climate has worsened
The business climate in professional, scientific and technical activities has lost three points (104). It stands however above its average level. All balances of opinion have declined except that on past activity, which has risen. They all stand above their average.
The business climate has weakened in administrative and support service activities
In administrative and support service activities, the climate has lost one point. It has reached 104, above its average. All balances have deteriorated except that on expected activity, which has gone slightly up. The balances on employment and on past activity are below their average.
tableauTable 2 – Business climate composite indicator and balances of opinion by sub-sector in services
| Aggregated classification (NA 2008) at level A21 | Mean* | Aug. 18 | Sept. 18 | Oct. 18 | Nov. 18 |
|---|---|---|---|---|---|
| Road transport (8%) | |||||
| Composite indicator | 100 | 108 | 107 | 109 | 108 |
| Past activity | –6 | 10 | 11 | 8 | 3 |
| Expected activity | –7 | 3 | 0 | 4 | 6 |
| Expected demand | –9 | 7 | 2 | 6 | 5 |
| Past employment | –5 | 5 | –3 | 4 | 0 |
| Expected employment | –8 | 2 | 4 | 9 | 2 |
| General outlook | –20 | –6 | –4 | 0 | –3 |
| Accommodation and food service activities (11%) | |||||
| Composite indicator | 100 | 112 | 112 | 109 | 112 |
| Past activity | –7 | –6 | –8 | 2 | 15 |
| Expected activity | –7 | 5 | 1 | 1 | –1 |
| Expected demand | –9 | –4 | 7 | –1 | 4 |
| Past employment | –4 | –1 | 5 | –1 | –2 |
| Expected employment | –5 | 6 | –6 | –8 | –10 |
| General outlook | –13 | 7 | 1 | –2 | 1 |
| Information and communication (24%) | |||||
| Composite indicator | 100 | 101 | 102 | 100 | 100 |
| Past activity | 8 | 8 | 4 | –6 | –4 |
| Expected activity | 9 | 5 | 12 | 10 | 6 |
| Expected demand | 10 | 4 | 4 | –6 | 3 |
| Past employment | 6 | 6 | 2 | 8 | 10 |
| Expected employment | 11 | 14 | 17 | 17 | 14 |
| General outlook | 0 | –1 | 1 | –2 | 0 |
| Real estate activities (13%) | |||||
| Composite indicator | 100 | 85 | 89 | 89 | 89 |
| Past activity | 7 | –14 | –6 | –7 | –2 |
| Expected activity | 7 | –2 | 0 | –1 | –1 |
| Expected demand | 2 | 5 | 5 | 8 | 8 |
| Past employment | 3 | –9 | –8 | –5 | –6 |
| Expected employment | 3 | 7 | 7 | 5 | 1 |
| General outlook | –3 | –15 | –11 | –12 | –14 |
| Professional, scientific and technical activities (24%) | |||||
| Composite indicator | 100 | 104 | 107 | 107 | 104 |
| Past activity | –1 | 1 | 1 | 2 | 5 |
| Expected activity | –2 | –1 | 5 | 2 | –1 |
| Expected demand | –5 | 4 | 0 | 2 | 0 |
| Past employment | 1 | –2 | 1 | 7 | 2 |
| Expected employment | 1 | 2 | 9 | 8 | 5 |
| General outlook | –8 | –4 | –2 | 2 | –2 |
| Administrative and support service activities (18%) | |||||
| Composite indicator | 100 | 107 | 108 | 105 | 104 |
| Past activity | 6 | 6 | 9 | 3 | 2 |
| Expected activity | 5 | 15 | 15 | 12 | 13 |
| Expected demand | 3 | 13 | 15 | 11 | 8 |
| Past employment | 9 | 8 | 2 | –11 | –16 |
| Expected employment | 8 | 7 | 11 | 4 | 2 |
| General outlook | –4 | 4 | 6 | 9 | 6 |
- The figures in parentheses indicate the weights used to aggregate the sub-sector balances of opinion.
- *Composite indicator: average since 1989 (February 2006 for road transport); balances of opinion: average since 1988 (February 2006 for road transport)
- Source: INSEE, monthly business survey in services.
Documentation
Abbreviated Methodology (2017) (pdf,177 Ko)
Pour en savoir plus
Time series : Economic outlook surveys – Services
