


 20 November 2018
2018- n° 300The unemployment rate was stable in Q3 2018 ILO Unemployment and Labour Market-related indicators (Labour Force Survey results)
- third quarter 2018
20 November 2018
2018- n° 300The unemployment rate was stable in Q3 2018 ILO Unemployment and Labour Market-related indicators (Labour Force Survey results)
- third quarter 2018
On average in Q3 2018, the average ILO unemployment rate in metropolitan France and the overseas departments (excluding Mayotte) stood at 9.1% of the labour force, as in the previous quarter. The unemployment rate is now 0.5 points lower than a year ago.
In metropolitan France, the number of unemployed increased by 22,000 in Q3 2018 to 2.6 million people; the unemployment rate was stable over a quarter, standing at 8.8% of the labour force. The unemployment rate rose among youths, especially among young men (+1.0 points). It was stable for persons aged 25 to 49 and edged down for those aged 50 and over.
The unemployment rate in France stood at 9.1% of active population in Q3 2018
On average in Q3 2018, the average ILO unemployment rate in metropolitan France and the overseas departments (excluding Mayotte) stood at 9.1% of the labour force, as in the previous quarter. The unemployment rate is now 0.5 points lower than a year ago.
In metropolitan France, the number of unemployed increased by 22,000 in Q3 2018 to 2.6 million people; the unemployment rate was stable over a quarter, standing at 8.8% of the labour force. The unemployment rate rose among youths, especially among young men (+1.0 points). It was stable for persons aged 25 to 49 and edged down for those aged 50 and over.
Long-term unemployment declined slightly
Among the unemployed, 1.0 million declared that they had been seeking a job for at least one year. The long-term unemployment rate stood at 3.4% of the labour force in Q3 2018. This rate decreased by 0.2 points over the quarter and 0.8 points over a year.
graphiqueGraph1 – ILO-unemployment rate
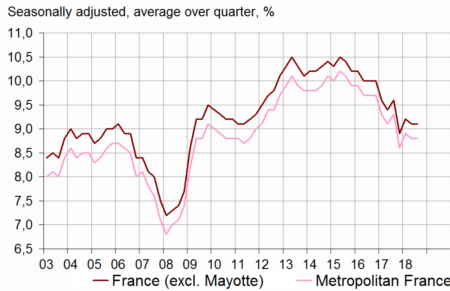
- Estimation within +/-0.3 points of the level of unemployment rate and of its quarterly variations
- Scope: population of people living in households, people aged 15 years or more
- Source: INSEE, Labour Force Survey
tableauTable1 – ILO-unemployment rate in metropolitan France
| ILO-unemployment rate (%) | Variation in points | Thousands | |||
|---|---|---|---|---|---|
| 2018Q2 | 2018Q3 (p) | over quarter | over year | 2018Q3 (p) | |
| Unemployed persons | 8.8 | 8.8 | 0.0 | -0.5 | 2,567 |
| 15-24 years | 20.2 | 20.6 | 0.4 | -0.9 | 581 |
| 25-49 years | 8.2 | 8.2 | 0.0 | -0.7 | 1,456 |
| 50 years and more | 6.3 | 6.1 | -0.2 | -0.3 | 530 |
| Men | 8.8 | 8.9 | 0.1 | -0.5 | 1,341 |
| 15-24 years | 21.4 | 22.4 | 1.0 | -0.2 | 350 |
| 25-49 years | 7.8 | 7.9 | 0.1 | -0.5 | 716 |
| 50 years and more | 6.4 | 6.3 | -0.1 | -0.7 | 275 |
| Women | 8.8 | 8.7 | -0.1 | -0.5 | 1,225 |
| 15-24 years | 18.7 | 18.4 | -0.3 | -1.7 | 231 |
| 25-49 years | 8.6 | 8.7 | 0.1 | -0.7 | 740 |
| 50 years and more | 6.2 | 6.0 | -0.2 | 0.2 | 255 |
| Long-term unemployed persons | 3.6 | 3.4 | -0.2 | -0.8 | 998 |
- (p) = provisional results
- Scope : population of people living in households, people aged 15 years or more in metropolitan France
- Source: INSEE, Labour Force Survey
In metropolitan France, among inactive people as defined by the ILO, 1.5 million persons wished to work without being considered as unemployed according to the ILO definition: they made up the halo of unemployment. Their number was virtually stable quarter on quarter (+ 8 000), and increased by 48,000 over a year.
graphiqueGraph2 – People in the halo of unemployment
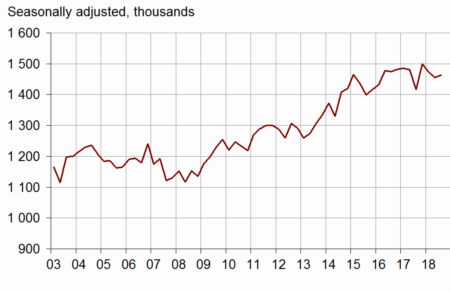
- Scope: population of people living in households in metropolitan France, people aged 15 years or over
- Source: INSEE, Labour Force Survey
The youths' employment rate went up sharply
The employment rate of the population aged 15-64 years increased slightly (+0.1 points) in Q3 2018. It stood at 65.9%, its highest level since the early 1980s. It increased by 0.8 percentage points year on year. Over the quarter, it went up by 0.5 points for persons aged 15 to 24 and was almost unchanged among other age groups.
Permanent employment rate for people aged 15 to 64 stood at 49.4% in Q3 2018. It increased a little over the quarter (+0.1 points) and by 0.6 points over a year. Fixed-term and temporary employment rate was practically stable (–0.1 points). It stood at 7.7%, 0.4 point below its higher level (–0.2 points), reached at the end of 2017.
More full-time jobs, fewer part-time jobs
Full-time employment rate remained at 54.1% in Q3 2018. It increased by 0.3 points over a quarter and 0.9 points over a year. Part-time employment rate reached 11.7%. It fell by 0.3 percentage points compared to Q2 2018 and 0.2 point compared to Q3 2017.
tableauTable2 – ILO employment rate in the population aged 15-64 years
| % of people in the age group | Variation in points over | |||
|---|---|---|---|---|
| 2018Q2 | 2018Q3 (p) | quarter | year | |
| Employed people | 65.8 | 65.9 | 0.1 | 0.8 |
| Men | 69.3 | 69.3 | 0.0 | 0.4 |
| Women | 62.4 | 62.5 | 0.1 | 1.0 |
| 15-24 years | 29.9 | 30.4 | 0.5 | 1.3 |
| 25-49 years | 81.2 | 81.1 | -0.1 | 0.5 |
| 50-64 years | 62.3 | 62.4 | 0.1 | 1.1 |
| Included : 55-64 years | 51.9 | 52.3 | 0.4 | 1.1 |
| Permanent employment | 49.3 | 49.4 | 0.1 | 0.6 |
| Fixed-term and temporary employment | 7.8 | 7.7 | -0.1 | -0.2 |
| Full-time employment | 53.8 | 54.1 | 0.3 | 0.9 |
| Part-time employment | 12.0 | 11.7 | -0.3 | -0.2 |
| Full-time equivalent employment rate | 60.9 | 61.1 | 0.2 | 0.8 |
- (p) = provisional results
- Scope: population of people living in households in metropolitan France, people aged 15-64 years
- Source: INSEE, Labour Force Survey
The underemployment rate diminished
In Q3 2018, 5.6% of the employed persons were underemployed. It mainly concerns people who have a part-time job and wish to work more. This share decreased by 0.2 points compared to Q2 2018, and 0.6 points over a year.
graphiqueGraph3 – Employment rate by age group
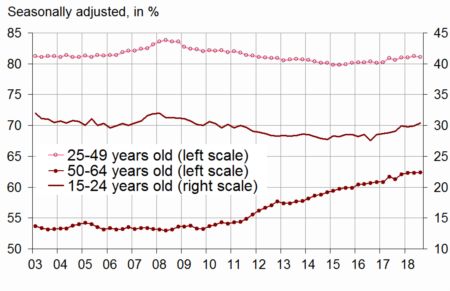
- Scope: population of people living in households in metropolitan France, people aged 15-64 years
- Source: INSEE, Labour Force Survey
The activity rate increased slightly in Q3 2018
The activity rate of people aged 15-64 increased slightly (+0.1 points) at 72.3% in Q3 2018, its highest level since the beginning of the series (1975). It increased by 0.4 percentage points compared to Q3 2017.
tableauTable3 – ILO activity rate in the population aged 15-64 years
| % of people in the age group | Variation in points over | |||
|---|---|---|---|---|
| 2018Q2 | 2018Q3 (p) | quarter | year | |
| Active people | 72.2 | 72.3 | 0.1 | 0.4 |
| Men | 76.1 | 76.2 | 0.1 | 0.1 |
| Women | 68.5 | 68.6 | 0.1 | 0.8 |
| 15-24 years | 37.5 | 38.2 | 0.7 | 1.1 |
| 25-49 years | 88.5 | 88.4 | -0.1 | 0.0 |
| 50-64 years | 66.6 | 66.7 | 0.1 | 1.1 |
| Included : 55-64 years | 55.6 | 56.0 | 0.4 | 1.4 |
- (p) = provisional results
- Scope: population of people living in households in metropolitan France, people aged 15-64 years
- Source: INSEE, Labour Force Survey
Revisions
Compared to the provisional estimate published on 14 August 2018, ILO unemployment in Q2 2018 is unchanged in France. It has been upgraded by 0.1 percentage points in metropolitan France (from 8.7% to 8.8%), due to seasonal adjustment coefficients recalculation.
Pour en savoir plus
