


 12 October 2018
2018- n° 271Slight rise in business start-ups in September 2018 Enterprise births - September 2018
12 October 2018
2018- n° 271Slight rise in business start-ups in September 2018 Enterprise births - September 2018
In September 2018, the number of business births for all enterprises increased slightly (+0.8% after +4.5% in August, seasonally and working-day adjusted). Conventional businesses start-ups rose (+1.5% after +2.9%) whereas micro-entrepreneurs' registrations were virtually stable (+0.1% after +6.6%).
In September 2018, the number of business births for all enterprises increased slightly (+0.8% after +4.5% in August, seasonally and working-day adjusted). Conventional businesses start-ups rose (+1.5% after +2.9%) whereas micro-entrepreneurs' registrations were virtually stable (+0.1% after +6.6%).
graphiqueGraph1 – Monthly business start-ups (SA-WDA *)
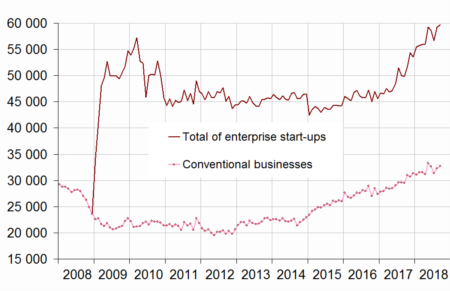
- * Seasonally and working-day adjusted data
- Source: INSEE, REE (Sirene)
tableauTable1 – Business set-ups by month (SA-WDA *)
| June 2018 | July 2018 | Aug. 2018 | Sept. 2018 | |
|---|---|---|---|---|
| Total businesses set-ups | 58,619 | 56,634 | 59,210 | 59,700 |
| Variation [m-o-m] % | -1.1 | -3.4 | 4.5 | 0.8 |
| Conventional businesses | 32,641 | 31,382 | 32,303 | 32,773 |
| Variation [m-o-m] % | -1.9 | -3.9 | 2.9 | 1.5 |
| Self-managed micro-entrepreneurs | 25,978 | 25,252 | 26,907 | 26,927 |
| Variation [m-o-m] % | -0.2 | -2.8 | 6.6 | 0.1 |
- * Seasonally and working-day adjusted data
- Source: INSEE, REE (Sirene)
+17.9% over the twelve last months
The raw number of business start-ups totted up during the last twelve months kept accelerating (+17.9% after +16.7% in August and +16.2% in July). All the types of business start-ups increased: micro-entrepreneurs' registrations (+27.9%), conventional sole proprietorship start-ups (+23.5%) and, to a lesser extent, company births (+2.0%).
Upsurge of business setp-ups in transportation and storage over the three last months
The raw number of business start-ups totted up during the last three months went up sharply (+17.6% over one year). The sector “Transportation and storage” was the one that contributed the most to this rise (rise by +7,400 business start-ups, which came to a contribution of 5.5 points)1. Within it, the increase was the higher in other activities of post and mail, which includes home-delivery (rise by +6,400 business start-ups).
More than two business set-ups out of five are self-managed micro-entrepreneurs' registrations
In September 2018, the share of micro–entrepreneurs' registrations in the businesses set up over the last twelve months grew for the eleventh month in a row and reached 43.7%.
tableauTable0 – Business set-ups distribution by type
| July 2018 | Aug. 2018 | Sept. 2018 | |
|---|---|---|---|
| Companies | 30.3 | 30.0 | 29.7 |
| Sole proprietorships excluding self-managed micro-entrepreneurs | 26.7 | 26.7 | 26.6 |
| Self-managed micro-entrepreneurs | 43.0 | 43.3 | 43.7 |
- Source: INSEE, REE (Sirene)

1 The contribution of a sector to the overall variation is the variation observed in this sector, weighted by the share of this sector in the total number of births.
tableauTable2 – Cumulated business start-ups by type
| Moving total % change * | Moving total | Moving total | ||
|---|---|---|---|---|
| over 3 months | over 12 months | January- September 2018 | January- September 2017 | |
| Total | 17.6 | 17.9 | 512,089 | 432,865 |
| Companies | 2.6 | 2.0 | 148,241 | 147,210 |
| Conventional sole proprietorships | 18.9 | 23.5 | 138,392 | 111,421 |
| Self-managed micro-entrepreneurs | 28.1 | 27.9 | 225,456 | 174,234 |
- * Total of business start-ups during the last 3 or 12 months compared with the same months a year earlier
- Source: INSEE, REE (Sirene)
Revisions
The variation in the overall number of business births in August 2018 has been lowered by 0.3 points to +4.5% due to the revision of raw data and the update of the SA-WDA parameters.
Business set-ups by economic activity
graphiqueGraph2 – Trade and business support activities monthly start-ups (SA-WDA *)
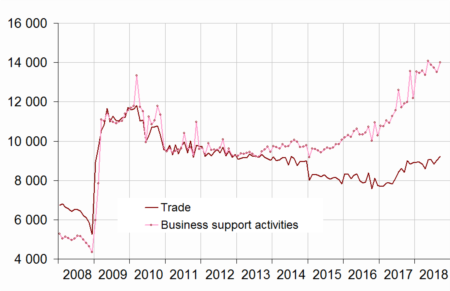
- * Seasonally and working-day adjusted data
- Source: INSEE, REE (Sirene)
graphiqueGraph3 – Construction and transportation business monthly set-ups (SA-WDA *)
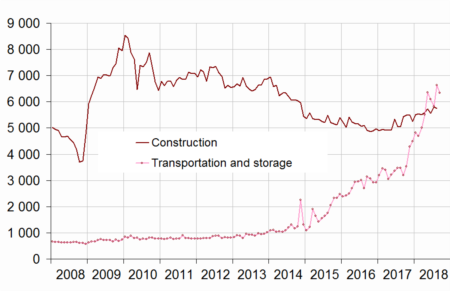
- * Seasonally and working-day adjusted data
- Source: INSEE, REE (Sirene)
tableauTable3 – Number of monthly business set-ups (incl. self-managed micro-entrepreneurs)
| NA | July 2018 | Aug. 2018 | Sept. 2018 | |
|---|---|---|---|---|
| Total | 56,634 | 59,210 | 59,700 | |
| Industry | BE | 2,384 | 2,494 | 2,403 |
| Of which Manufacturing | C | 2,085 | 2,254 | 2,165 |
| Construction | FZ | 5,570 | 5,811 | 5,749 |
| Wholesale and retail trade, Transport, Accommodation and Food and beverage activities | GI | 17,411 | 18,493 | 18,422 |
| Trade | G | 8,819 | 9,015 | 9,233 |
| Transportation and storage | H | 5,822 | 6,641 | 6,344 |
| Accommodation and food service activities | I | 2,770 | 2,837 | 2,846 |
| Information and communication | JZ | 2,804 | 3,114 | 2,983 |
| Financial and insurance activities | KZ | 1,398 | 1,511 | 1,500 |
| Real estate activities | LZ | 2,061 | 2,346 | 2,425 |
| Business support activities | MN | 13,723 | 13,517 | 14,012 |
| Public administration and defence, education, human health and social work activities | OQ | 6,066 | 6,467 | 6,612 |
| Other services activities | RS | 5,218 | 5,456 | 5,593 |
- * Seasonally and working-day adjusted data
- Source: INSEE, REE (Sirene)
tableauTable4 – Fluctuation in the number of business set-ups (incl. self-managed micro-entrepreneurs)
| NA | Sept. 18 / août 18 | Moving total % change** | ||
|---|---|---|---|---|
| SA-WDA * | over 3 months | over 12 months | ||
| Total | 0.8 | 17.6 | 17.9 | |
| Industry | BE | -3.7 | 13.9 | 13.0 |
| Of which Manufacturing | C | -4.0 | 15.1 | 15.8 |
| Construction | FZ | -1.1 | 12.6 | 11.5 |
| Wholesale and retail trade, Transport, Accommodation and Food and beverage activities | GI | -0.4 | 26.5 | 22.7 |
| Trade | G | 2.4 | 8.3 | 11.8 |
| Transportation and storage | H | -4.5 | 86.0 | 62.6 |
| Accommodation and food service activities | I | 0.3 | 8.6 | 6.8 |
| Information and communication | JZ | -4.2 | 17.5 | 18.0 |
| Financial and insurance activities | KZ | -0.7 | 7.5 | 5.9 |
| Real estate activities | LZ | 3.4 | 18.3 | 21.8 |
| Business support activities | MN | 3.7 | 17.5 | 20.3 |
| Public administration and defence, education, human health and social work activities | OQ | 2.2 | 5.1 | 7.7 |
| Other services activities | RS | 2.5 | 20.7 | 22.4 |
- * Seasonally and working-day adjusted data
- ** Total of business start-ups during the last 3 or 12 months compared with the same months a year earlier
- Source: INSEE, REE (Sirene)
Documentation
Note méthodologique_anglaise_ Février 2018 (pdf,29 Ko)
Pour en savoir plus
Time series : Business demography
