


 28 September 2018
2018- n° 256Household consumption expenditure on goods recovered in August (+0.8%) Household consumption expenditure on goods - August 2018
28 September 2018
2018- n° 256Household consumption expenditure on goods recovered in August (+0.8%) Household consumption expenditure on goods - August 2018
In August 2018, household expenditure on goods increased by 0.8% in volume*, after a stability (+0.0%) in July. This growth was driven by the jump of manufactured good consumption (+2.5% after +0.0%), in spite of the decline in food consumption (–0.6%) and energy spending (–0.5%).
In August 2018, household expenditure on goods increased by 0.8% in volume*, after a stability (+0.0%) in July. This growth was driven by the jump of manufactured good consumption (+2.5% after +0.0%), in spite of the decline in food consumption (–0.6%) and energy spending (–0.5%).
graphiqueGraph1 – Total consumption of goods
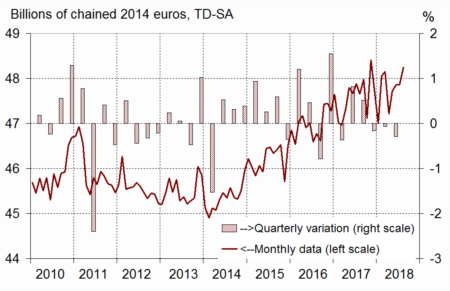
- Source: INSEE

*Volumes are measured at chain-link previous year prices (2014 euro billions) and all figures are trading-day and seasonally adjusted.
Engineered goods: significant increase
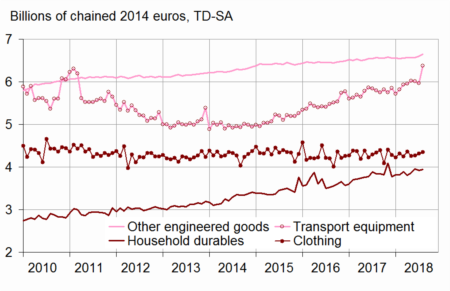
In August, expenditure on engineered goods increased sharply (+2.5%), especially on durable goods.
Durables: very sharp rise
Consumption of durables increased strongly in August (+4.1%), in particular in transport equipment (+6.9%). Indeed, new car sales reached an exceptionnally high level, in anticipation of the tightening of the new car approval tests in Europe on September 1st. Household durables spending rebounded (+0.4% after –0.7%), driven by furniture purchases, and despite the return to normal of television set purchases.
Textile-clothing: slight increase
Expenses on textile-clothing increased in August (+0.8%) for the third consecutive month, mainly driven by shoes purchases. Clothes spending decreased slightly (–0.2%).
Other engineered goods: slight acceleration
The consumption of “other engineered goods” accelerated a little in August (+0.8% after +0.5%), driven by sales of perfume and beauty products.
graphiqueGraph2 – Breakdown of engineered goods
- Source: INSEE
Food products: small decrease
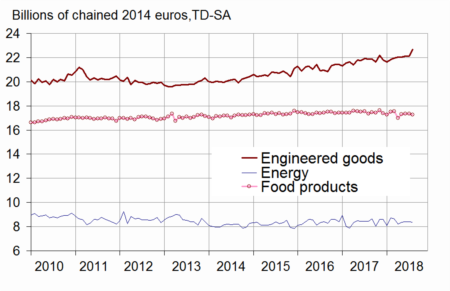
In August,food consumption decreased slightly (–0.6 % after +0.1%). In particular, consumption of meat and meat products declined slightly as well as the one of fruits and vegetables. Tobacco consumption declined again.
graphiqueGraph3 – Food products. engineered goods and energy
- Source: INSEE
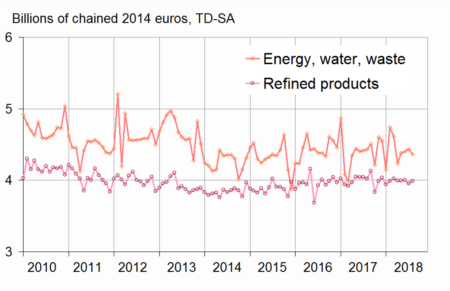
Energy: slight downturn
In August, energy consumption declined a little (–0.5%) for the second consecutive month. Gas and electricity consumption decreased, while refined products consumption rebounded sharply (+1.0% after –1.3%).
graphiqueGraph4 – Breakdown of energy
- Source: INSEE
The variation in July 2018 was revised downwards
Compared to the previous estimation, the change of household expenditure on goods in July 2018 was revised downwards: +0.0% instead of +0.1%. Indeed, new information has been integrated and the seasonal adjustment coefficients have been updated.
tableauTable – Household consumption expenditure on goods
| Weight (1) | June 2018 | July 2018 | Aug 2018 | Aug 18 / Aug 17 | Q / Q-1 | |
|---|---|---|---|---|---|---|
| Food products | 38 | 0.1 | 0.1 | –0.6 | –0.6 | 0.2 |
| - excl. Tobacco | 34 | 0.1 | 0.2 | –0.6 | 0.3 | 0.0 |
| Engineered goods | 45 | 0.4 | 0.0 | 2.5 | 3.7 | 1.4 |
| - Durables | 22 | 0.7 | –0.7 | 4.1 | 6.5 | 2.1 |
| Including : | 0.0 | 0.0 | ||||
| - Transport equipment | 12 | –0.2 | –0.8 | 6.9 | 10.1 | 2.4 |
| - Household durables | 7 | 2.4 | –0.7 | 0.4 | 2.8 | 2.3 |
| - Textile-clothing | 9 | 0.2 | 1.1 | 0.8 | 0.2 | 0.5 |
| - Other engineered goods | 14 | 0.0 | 0.5 | 0.8 | 1.3 | 0.6 |
| Energy | 18 | 0.4 | –0.2 | –0.5 | –1.2 | –0.4 |
| - Energy. water. waste | 10 | 0.6 | 0.8 | –1.7 | –1.5 | –0.2 |
| - Refined Products | 8 | 0.2 | –1.3 | 1.0 | –0.9 | –0.6 |
| Total | 100 | 0.3 | 0.0 | 0.8 | 1.3 | 0.6 |
| - Including Manufactured goods | 84 | 0.3 | 0.0 | 1.2 | 1.9 | 0.8 |
- (1) Weighting in the consumption expenditure on goods in value in 2017
- (2) Last three months / previous three months
Documentation
Methodology (pdf,23 Ko)
Pour en savoir plus
