


 13 September 2018
2018- n° 238In August 2018, consumer prices rose by 0.5% over one month and 2.3% year on year Consumer price index - final results - August 2018
13 September 2018
2018- n° 238In August 2018, consumer prices rose by 0.5% over one month and 2.3% year on year Consumer price index - final results - August 2018
In August 2018, the Consumer Prices Index (CPI) recovered to +0.5% over a month, after a slight downturn in July. This rebound came from a seasonal increase in manufactured product prices (+1.1% after −2.8%) after the summer sales in the metropolitan area. Moreover, food prices accelerated (+0.3% after +0.1%), in the wake of those in food excluding fresh products. Contrariwise, services prices sharply slowed down (+0.3% after +1.1%) due to the seasonal downturn in airfares and the drop in communication services prices.
Monthly change: +0.5% in August; Year-on-year change: +2.3%
In August 2018, the Consumer Prices Index (CPI) recovered to +0.5% over a month, after a slight downturn in July. This rebound came from a seasonal increase in manufactured product prices (+1.1% after −2.8%) after the summer sales in the metropolitan area. Moreover, food prices accelerated (+0.3% after +0.1%), in the wake of those in food excluding fresh products. Contrariwise, services prices sharply slowed down (+0.3% after +1.1%) due to the seasonal downturn in airfares and the drop in communication services prices.
Seasonally adjusted, consumer prices slowed down to +0.1% after +0.3% in July.
Year on year, consumer prices rose by 2.3%, as in the previous month. This slight drop in inflation resulted from a year-on-year slowdown in energy prices, partly offset by an acceleration in food prices. Services prices rose at the same pace as in the previous month and those of manufactured product fell by 0.1%, as in July.
Stability in core inflation year on year
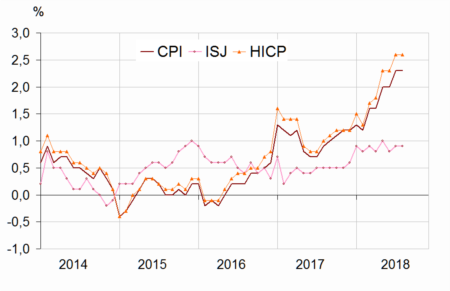
Year on year, core inflation was stable: +0.9% as in the previous month. The Harmonised Index of Consumer Prices (HICP) recovered (+0.5% in August after −0.1% in July); year on year, it grew by 2.6%, as in the previous month.
Slowdown in energy prices year on year
In August 2018, energy inflation dropped after four consecutive months of increase (+13.0% year on year after +14.3% in July). The prices of petroleum products slowed down (+20.1% year on year after +21.8%) and those of electricity sharply slowed down (+0.3% after +2.1%), due to a drop in fees over a month. Contrariwise, gas prices gathered pace again (+19.8% year on year after +18.8%).
tableauTable1 – Detailed figures for various groups
| Items | Weight | Index | Percentage change | ||
|---|---|---|---|---|---|
| 2018 | Aug. 2018 | m-on-m change(2) | y-on-y change(3) | ||
| a) All households | |||||
| Overall | 10000 | 103.78 | 0.5 | 2.3 | |
| Overall SA(1) | 10000 | 103.52 | 0.1 | 2.3 | |
| Food | 1627 | 103.88 | 0.3 | 2.2 | |
| Fresh food | 243 | 112.89 | −0.2 | 6.9 | |
| Other food | 1384 | 102.43 | 0.4 | 1.4 | |
| Tobacco | 193 | 119.77 | 0.0 | 16.8 | |
| Manufactured products | 2594 | 97.99 | 1.1 | −0.1 | |
| Clothing and footwear | 416 | 95.97 | 6.3 | 0.8 | |
| Medical products | 425 | 92.56 | −0.2 | −2.2 | |
| Other manufactured products | 1753 | 99.76 | 0.4 | 0.2 | |
| Energy | 777 | 114.26 | 0.0 | 13.0 | |
| Petroleum products | 408 | 121.17 | 0.2 | 20.1 | |
| Services | 4809 | 104.70 | 0.3 | 1.3 | |
| Actual rentals and services for dwellings | 764 | 100.73 | −0.1 | −0.3 | |
| Health services | 617 | 102.25 | −0.4 | 0.7 | |
| Transport | 282 | 109.33 | 0.0 | 1.9 | |
| Communication | 223 | 96.71 | −1.6 | −0.9 | |
| Other services | 2923 | 106.47 | 0.7 | 2.0 | |
| Total except rents and tobacco | 9192 | 103.74 | 0.5 | 2.2 | |
| Total except tobacco | 9807 | 103.48 | 0.5 | 2.0 | |
| b) Urban working-class households or households of employees | |||||
| All products excluding tobacco | 9706 | 103.02 | 0.5 | 1.8 | |
| c) Households that belong to the lowest equivalized disposable income quintile - France | |||||
| All products excluding tobacco | 9700 | 102.91 | 0.4 | 1.9 | |
- (1) seasonally adjusted
- (2) [m/(m-1)]
- (3) [m/(m-12)]
- Geographical coverage: France excluding Mayotte
- Source: INSEE - Consumer Price Indices
Acceleration in food prices
In August 2018, food prices rose by 2.2% over a year, after +1.9% in the previous month. The prices of fresh products rose more (+6.9% year on year after +6.4%), because of a marked rebound in fresh potatoes whereas those of fresh vegetables (+9,8% after +10.1%) and of fresh fruits (+7,4% after +8.0%) slowed down year on year. Excluding fresh products, food prices gathered pace by 1.4% over a year, the highest increase since December 2012, due to a dynamism in alcoholic or not beverages prices.
Stability in services inflation
Year on year, services prices rose by 1.3%, as in the previous month. Transport prices again increased (+1.9% year on year after +1,4%), particularly those of airfares (+3.5% year on year after +1.0%). In this second month of school holidays, accommodation services prices accelerated to +6.9% year on year, after +5.7% in July. Health services prices were more dynamic than in July (+0.7% year on year). Contrariwise, communication services prices fell back after three months of rise (−0.9% after +0.7%), due to promotional offers in mobile and group bundled services. Finally, the prices of actual rentals and of services for dwellings decreased by 0.3%, as in July.
Further slight decline in manufactured products prices year on year
Year on year, manufactured products prices dropped by 0.1%, as in the previous month. Clothing and footwear prices rose by 0.8% over a year, as in July. The prices of “other manufactured products” slightly accelerated (+0.2% year on year after +0.1%): the higher rise in new motor cars prices (+2.6% year on year after +2.3%) was partly offset by a more marked drop in the prices of household appliances (−1.4% year on year after −0.7%) and of phones (−9,0% over a year after −7.7%). Furthermore, health product prices decreased by 2.2% year on year for the third consecutive month.
graphiqueGraph1 – Consumer Price Index (CPI), core inflation (ISJ) (1) and Harmonised Index of Consumer Prices (HICP) (2) year-on-year changes
tableauTable2 – Detailed figures for Core inflation(1) and HICP(2)
| Items | Weight | Index | Percentage change | |
|---|---|---|---|---|
| 2018 | Aug. 2018 | m-on-m change(3) | y-on-y change(4) | |
| Core inflation - All items | 6041 | 102.08 | 0.1 | 0.9 |
| Food excluding fresh products, meat, milk and exotic products | 740 | 101.53 | 0.3 | 0.9 |
| Manufactured products | 2125 | 99.90 | −0.2 | 0.3 |
| Services including actual rentals and services for dwellings | 3176 | 103.74 | 0.2 | 1.4 |
| HICP - All items | 104.35 | 0.5 | 2.6 | |
- (1) Core inflation indicator excludes public sector prices, the most volatile consumer prices and the tax measures. Seasonally adjusted, this index is calculated for all households in France excluding overseas departments and territories. (in French “indice d'inflation sous-jacent - ISJ”)
- (2) HICP: Harmonised Indices of Consumer Prices are inflation figures designed for international comparison between Member states of the European Union. This index is calculated for all households in France excluding Mayotte.
- (3) [m/(m-1)]
- (4) [m/(m-12)]
- Source: INSEE - Consumer Price Indices
Revisions
Compared with the provisional estimates published on August 31, 2018, the month-on-month and year-on-year changes in the CPI are confirmed. The month-on-month change in the HICP is dropped by 0.1 points and the year-on-year one is unchanged.
Documentation
Methodology (pdf,141 Ko)
Pour en savoir plus
