


 14 August 2018
2018- n° 211The unemployment rate decreased by 0.1 points in Q2 2018 ILO Unemployment and Labour Market-related indicators (Labour Force Survey results)
- second quarter 2018
14 August 2018
2018- n° 211The unemployment rate decreased by 0.1 points in Q2 2018 ILO Unemployment and Labour Market-related indicators (Labour Force Survey results)
- second quarter 2018
On average in Q2 2018, the average ILO unemployment rate in metropolitan France and the overseas departments (excluding Mayotte) stood at 9.1% of the labour force, after 9.2% in Q1 2018. Over a year, the unemployment rate decreased by 0.3 points.
In metropolitan France, the number of unemployed fell by 48,000 in Q2 2018 to 2.5 million people; thus, the unemployment rate decreased by 0.2 points compared to previous quarter (after having increased by 0.3 points in Q1 2018), standing at 8.7% of the labour force. At the same time, the employment rate rose by 0.1 percentage points and the activity rate was stable. The unemployment rate declined among youths and persons aged 25 to 49, whereas it was stable for those aged 50 and over.
- The unemployment rate in France stood at 9.1% of active population in Q2 2018
- Long-term unemployment was stable
- The employment rate remained high in Q2 2018
- The fixed-term and temporary employment rate decreased slightly
- Underemployment was virtually stable
- The activity rate was stable in Q2 2018
- Revisions
The unemployment rate in France stood at 9.1% of active population in Q2 2018
On average in Q2 2018, the average ILO unemployment rate in metropolitan France and the overseas departments (excluding Mayotte) stood at 9.1% of the labour force, after 9.2% in Q1 2018. Over a year, the unemployment rate decreased by 0.3 points.
In metropolitan France, the number of unemployed fell by 48,000 in Q2 2018 to 2.5 million people; thus, the unemployment rate decreased by 0.2 points compared to previous quarter (after having increased by 0.3 points in Q1 2018), standing at 8.7% of the labour force. At the same time, the employment rate rose by 0.1 percentage points and the activity rate was stable. The unemployment rate declined among youths and persons aged 25 to 49, whereas it was stable for those aged 50 and over.
Long-term unemployment was stable
Among the unemployed, 1.0 million declared that they had been seeking a job for at least one year. The long-term unemployment rate stood at 3.6% of the labour force in Q2 2018, as in previous quarter. This rate decreased by 0.4 points compared to Q2 2017.
graphiqueGraph1 – ILO-unemployment rate
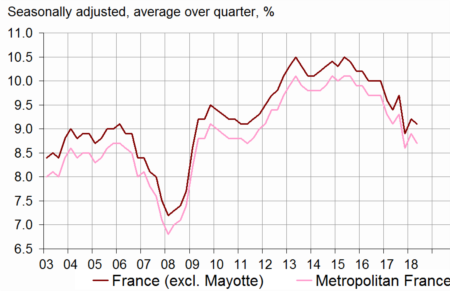
- Estimation within +/-0.3 point of the level of unemployment rate and of its quarterly variations
- Scope: population of people living in households, people aged 15 years or more
- Source: INSEE, Labour Force Survey
tableauTable1 – ILO-unemployment rate in metropolitan France
| ILO-unemployment rate (%) | Variation in points | Thousands | |||
|---|---|---|---|---|---|
| 2018Q1 | 2018Q2 (p) | over quarter | over year | 2018Q2 (p) | |
| Unemployed persons | 8.9 | 8.7 | –0.2 | –0.4 | 2,538 |
| 15-24 years | 20.8 | 20.1 | –0.7 | –2.6 | 554 |
| 25-49 years | 8.3 | 8.1 | –0.2 | –0.3 | 1,440 |
| 50 years and more | 6.3 | 6.3 | 0.0 | 0.0 | 544 |
| Men | 8.8 | 8.7 | –0.1 | –0.5 | 1,312 |
| 15-24 years | 20.6 | 21.2 | 0.6 | –2.0 | 322 |
| 25-49 years | 7.9 | 7.8 | –0.1 | –0.4 | 708 |
| 50 years and more | 6.6 | 6.4 | –0.2 | –0.2 | 281 |
| Women | 9.0 | 8.7 | –0.3 | –0.3 | 1,227 |
| 15-24 years | 21.1 | 18.7 | –2.4 | –3.3 | 232 |
| 25-49 years | 8.8 | 8.5 | –0.3 | –0.1 | 732 |
| 50 years and more | 5.8 | 6.2 | 0.4 | 0.2 | 263 |
| Long-term unemployed persons | 3.6 | 3.6 | 0.0 | –0.4 | 1,040 |
- (p) = provisional results
- Scope : population of people living in households, people aged 15 years or more in metropolitan France
- Source: INSEE, Labour Force Survey
In metropolitan France, among inactive people as defined by the ILO, 1.5 million persons wished to work without being considered as unemployed according to the ILO definition: they made up the halo of unemployment. Their number fell by 19,000 quarter on quarter, and by 25,000 compared to Q2 2017.
graphiqueGraph2 – People in the halo of unemployment
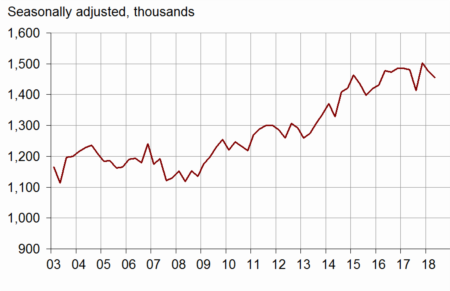
- Scope: population of people living in households in metropolitan France, people aged 15 years or over
- Source: INSEE, Labour Force Survey
The employment rate remained high in Q2 2018
The employment rate of the population aged 15-64 years stood at 65.8% in Q2 2018, its highest level since the early 1980s. It was virtually stable (+0.1 percentage points) compared to Q1 2018 and increased by 0.4 percentage points year on year. Over the quarter, it increased by 0.3 points for persons aged 25 to 49 and was practically stable among other age groups.
The fixed-term and temporary employment rate decreased slightly
Permanent employment rate for people aged 15 to 64 stood at 49.3% in Q2 2018. It was virtually stable over the quarter (+0.1 points). It increased by 0.4 points over a year. Fixed-term and temporary employment rate decreased by 0.2 percentage points. It stood at 7.8%, close to its Q2 2017 level (–0.1 points)
Full-time employment rate remained at 53.9% in Q2 2018. It is 0.6 points higher than its Q2 2017 level. Part-time employment rate rose by 0.2 percentage points compared to Q1 2018. It stood at 12.0%, its Q2 2017 level.
tableauTable2 – ILO employment rate in the population aged 15-64 years
| % of people in the age group | Variation in points over | |||
|---|---|---|---|---|
| 2018Q1 | 2018Q2 (p) | quarter | year | |
| Employed people | 65.7 | 65.8 | 0.1 | 0.4 |
| Men | 69.4 | 69.3 | –0.1 | 0.4 |
| Women | 62.2 | 62.5 | 0.3 | 0.6 |
| 15-24 years | 29.8 | 29.9 | 0.1 | 1.1 |
| 25-49 years | 81.0 | 81.3 | 0.3 | 0.4 |
| 50-64 years | 62.3 | 62.3 | 0.0 | 0.6 |
| Included : 55-64 years | 52.2 | 51.9 | –0.3 | 0.3 |
| Permanent employment | 49.2 | 49.3 | 0.1 | 0.4 |
| Fixed-term and temporary employment | 8.0 | 7.8 | –0.2 | –0.1 |
| Full-time employment | 53.9 | 53.9 | 0.0 | 0.6 |
| Part-time employment | 11.8 | 12.0 | 0.2 | 0.0 |
| Full-time equivalent employment rate | 60.9 | 60.9 | 0.0 | 0.5 |
- (p) = provisional results
- Scope: population of people living in households in metropolitan France, people aged 15-64 years
- Source: INSEE, Labour Force Survey
Underemployment was virtually stable
In Q2 2018, 5.8% of the employed persons were underemployed, which mainly concerns people who have a part-time job and wish to work more. This share is close to that of Q1 2018 (–0.1 points) and decreased by 0.2 points year on year.
graphiqueGraph3 – ILO underemployment rate
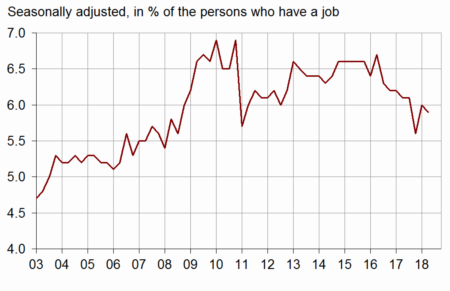
- Scope : population of people living in households in metropolitan France, people aged 15 years or over
- Source: INSEE, Labour Force Survey
The activity rate was stable in Q2 2018
The activity rate of people aged 15-64 was stable at 72.2% in Q1 2018, its highest level since the beginning of the series (1975). It increased by 0.2 percentage points compared to Q2 2017.
tableauTable3 – ILO activity rate in the population aged 15-64 years
| % of people in the age group | Variation in points over | |||
|---|---|---|---|---|
| 2018Q1 | 2018Q2 (p) | quarter | year | |
| Active people | 72.2 | 72.2 | 0.0 | 0.2 |
| Men | 76.1 | 76.0 | –0.1 | 0.0 |
| Women | 68.4 | 68.5 | 0.1 | 0.4 |
| 15-24 years | 37.7 | 37.4 | –0.3 | 0.1 |
| 25-49 years | 88.4 | 88.5 | 0.1 | 0.2 |
| 50-64 years | 66.6 | 66.6 | 0.0 | 0.7 |
| Included : 55-64 years | 55.9 | 55.7 | –0.2 | 0.8 |
- (p) = provisional results
- Scope: population of people living in households in metropolitan France, people aged 15-64 years
- Source: INSEE, Labour Force Survey
Revisions
Compared to the provisional estimate published on 23 May 2018, ILO unemployment, employment and activity rates in Q1 2018 are unchanged.
Pour en savoir plus
