


 12 July 2018
2018- n° 182In June 2018, consumer prices were stable over one month and rose by 2.0% year on
year Consumer price index - final results - June 2018
12 July 2018
2018- n° 182In June 2018, consumer prices were stable over one month and rose by 2.0% year on
year Consumer price index - final results - June 2018
In June 2018, the Consumer Prices Index (CPI) was stable over a month, after an acceleration in May (+0.4% after +0.2% in April). This stability resulted from a rise in energy prices, less markedly than in May (+0.9% after +2.0%), offset by a downturn in food prices (−0.2% after 0.9%). “Manufactured product” prices were unchanged after a 0.3% increase in the previous month. Services prices were also stable after +0.1% in May.
Monthly change: 0.0% in June; Year-on-year change: +2.0%
In June 2018, the Consumer Prices Index (CPI) was stable over a month, after an acceleration in May (+0.4% after +0.2% in April). This stability resulted from a rise in energy prices, less markedly than in May (+0.9% after +2.0%), offset by a downturn in food prices (−0.2% after 0.9%). “Manufactured product” prices were unchanged after a 0.3% increase in the previous month. Services prices were also stable after +0.1% in May.
Seasonally adjusted, consumer prices were stable after a slight acceleration to +0.3% in May.
Year on year, consumer prices rose by 2.0%, as in the previous month. This stability in inflation reflected two opposing trends: a sharp year-on-year acceleration in energy prices and, to a lesser extent, in these of food and tobacco, while those of services slowed down. “Manufactured product” prices fell at the same pace as in the previous month.
Drop in core inflation year on year
Year on year, core inflation slighlty dropped: +0.8% after +1.0% in the previous month. The Harmonised Index of Consumer Prices (HICP) were stable after an acceleration in May (+0.5%); year on year, it grew by 2.3%, as in the previous month.
Further acceleration in energy prices year on year
Energy infation sharply gathered pace in June 2018 for the third consecutive month (+12.3% year on year after +10.0%). Petroleum product prices rose more than in May (+21.0% year on year after +17.0%): falling in June 2017 (−2.2% over a month), their prices increased in June 2018 (+1.2%), but less pronounced than in the previous month in the wake of Brent prices (+3.5%). Moreover, gas prices strongly grew (+6.0% year on year after +4.1%).
tableauTable1 – Detailed figures for various groups
| Items | Weight | Index | Percentage change | ||
|---|---|---|---|---|---|
| 2018 | June 2018 | m-on-m change(2) | y-on-y change(3) | ||
| a) All households | |||||
| Overall | 10000 | 103.37 | 0.0 | 2.0 | |
| Overall SA(1) | 10000 | 103.05 | 0.0 | 2.0 | |
| Food | 1627 | 103.46 | −0.2 | 1.9 | |
| Fresh food | 243 | 113.22 | −1.4 | 5.9 | |
| Other food | 1384 | 101.88 | 0.0 | 1.2 | |
| Tobacco | 193 | 119.24 | 0.0 | 16.3 | |
| Manufactured products | 2594 | 99.67 | 0.0 | −0.2 | |
| Clothing and footwear | 416 | 104.88 | 0.3 | −0.3 | |
| Medical products | 425 | 92.84 | 0.1 | −2.2 | |
| Other manufactured products | 1753 | 100.17 | −0.1 | 0.2 | |
| Energy | 777 | 113.68 | 0.9 | 12.3 | |
| Petroleum products | 408 | 122.04 | 1.2 | 21.0 | |
| Services | 4809 | 103.18 | 0.0 | 1.2 | |
| Actual rentals and services for dwellings | 764 | 100.82 | −0.9 | −0.2 | |
| Health services | 617 | 102.49 | 0.0 | 0.5 | |
| Transport | 282 | 100.61 | 0.3 | 0.6 | |
| Communication | 223 | 98.32 | −1.3 | 0.7 | |
| Other services | 2923 | 104.59 | 0.2 | 1.7 | |
| Total except rents and tobacco | 9192 | 103.29 | 0.1 | 1.9 | |
| Total except tobacco | 9807 | 103.07 | 0.0 | 1.7 | |
| b) Urban working-class households or households of employees | |||||
| All products excluding tobacco | 9706 | 102.89 | 0.0 | 1.7 | |
| c) Households that belong to the lowest equivalized disposable income quintile - France | |||||
| All products excluding tobacco | 9700 | 102.67 | −0.1 | 1.7 | |
- (1) seasonally adjusted
- (2) [m/(m-1)]
- (3) [m/(m-12)]
- Geographical coverage: France excluding Mayotte
- Source: INSEE - Consumer Price Indices
Slight rise in food inflation
In June 2018, food prices barely gathered pace: +1.9% year on year, the highest increase since January 2013, after +1.8% in May. The prices of fresh food products rose more than in May (+5.9% year on year after +5.0%), due to a monthly downturn less pronounced this year (−1.4% against −2.3% in June 2017). Excluding fresh products, food prices were up by 1.2% year on year for the fifth consecutive month.
Tobacco prices remained dynamic (+16.3% year on year after +16.1%).
Drop in services inflation
Year on year, services prices sharply slowed down: +1.2% in June after +1.5%. The prices of actual rentals and services for dwellings edged down (−0.2% after +0.7%), due to a drop in social rental prices concurrent with these in individual housing benefits. Health services prices sharply slowed down (+0.5% year on year after +1.1%), the medical convention signed in August 2016 having provided changes of some fees in June 2017. Transport prices also rose less sharply (+0.6% year on year after +2.4%), due to a slowdown in airfares (+0.6% year on year after a +2.0% rebound in May). Moreover, the prices of rail transport slightly rose (−0.2% year on year after +0.8%), because of promotional offers in discount cards. The prices of communication services slowed down (+0.7% year on year after +1.1%). Contrariwise, accommodation services prices accelerated (+5.2% year on year after +3.5%).
Drop in manufactured products prices year on year
Year on year, “manufactured product” prices dropped by 0.2%, as in the previous month. Clothing and footwear prices dropped a little more than in May (−0.3% year on year after −0.2%), due to a sharper fall in clothing prices (−0.4% year on year after −0.1%). The prices of “other manufactured products” rose barely less (+0.2% year on year after +0.3%). New motor cars prices slowed down (+1.8% year on year after +2.2%) and games, toys and hobbies prices dropped more (−2.0% after −1.2%). Year on year, those in household appliances dropped less markedly than in the previous month (−1.2% after −1.7%) and those of furniture rebounded (+0.8% after −0.5%). On the other hand, health product prices dropped again (−2.2% year on year after −2.3%).
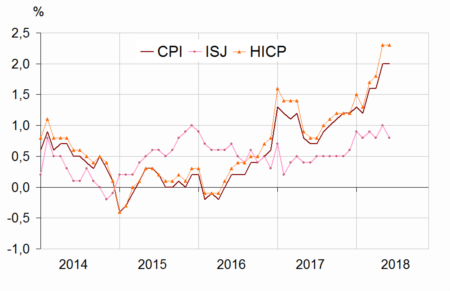
graphiqueGraph1 – Consumer Price Index (CPI), core inflation (ISJ) (1) and Harmonised Index of Consumer Prices (HICP) (2) year-on-year changes
tableauTable2 – Detailed figures for Core inflation(1) and HICP(2)
| Items | Weight | Index | Percentage change | |
|---|---|---|---|---|
| 2018 | June 2018 | m-on-m change(3) | y-on-y change(4) | |
| Core inflation - All items | 6041 | 101.87 | −0.1 | 0.8 |
| Food excluding fresh products, meat, milk and exotic products | 740 | 101.35 | 0.1 | 0.8 |
| Manufactured products | 2125 | 100.03 | 0.1 | 0.1 |
| Services including actual rentals and services for dwellings | 3176 | 103.27 | −0.4 | 1.2 |
| HICP - All items | 103.93 | 0.0 | 2.3 | |
- (1) Core inflation indicator excludes public sector prices, the most volatile consumer prices and the tax measures. Seasonally adjusted, this index is calculated for all households in France excluding overseas departments and territories. (in French “indice d'inflation sous-jacent - ISJ”)
- (2) HICP: Harmonised Indices of Consumer Prices are inflation figures designed for international comparison between Member states of the European Union. This index is calculated for all households in France excluding Mayotte.
- (3) [m/(m-1)]
- (4) [m/(m-12)]
- Source: INSEE - Consumer Price Indices
Revisions
Compared with the provisional estimates published on June 29, 2018, the month-on-month and year-on-year changes in the CPI and in the HICP are down by 0.1points.
Documentation
Methodology (pdf,141 Ko)
Pour en savoir plus
