


 15 June 2018
2018- n° 155In Q1 2018, the the labour cost index - wages and salaries increased by 0.5%, the
total labour cost index increased by 1.0% Labor cost index in industry, construction and services - first quarter 2018
15 June 2018
2018- n° 155In Q1 2018, the the labour cost index - wages and salaries increased by 0.5%, the
total labour cost index increased by 1.0% Labor cost index in industry, construction and services - first quarter 2018
In the first quarter of 2018, the labour cost index (LCI) - wages and salaries in the non-farm business sector slowed down hardly (+0.5% quarter on quarter, after +0.6% in Q4 2017 – seasonally adjusted data). Year on year, it rose by 1.7%, a slightly softer increase than in the fourth quarter (+2.0%). The average working time remained stable in the first quarter (0.0% y-o-y after +0.1% in Q4 2017).

Warnings
- Since 1st January 2018, the rate of the tax credit for encouraging competitiveness and jobs (CICE) in metropolitan France has decreased from 7% to 6%. The rate remains at 9% in the overseas departments.
- Hirings after 1st July 2017 are no longer entitled to the hiring premium measure in SMEs.
The wages and salary costs increased by 0.5%
In the first quarter of 2018, the labour cost index (LCI) - wages and salaries in the non-farm business sector slowed down hardly (+0.5% quarter on quarter, after +0.6% in Q4 2017 – seasonally adjusted data). Year on year, it rose by 1.7%, a slightly softer increase than in the fourth quarter (+2.0%). The average working time remained stable in the first quarter (0.0% y-o-y after +0.1% in Q4 2017).
graphiqueGraph1 – LCI - wages and salaries: Year-on-year changes
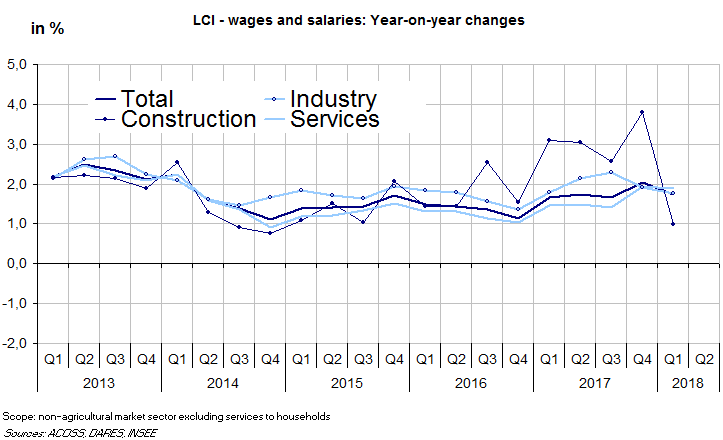
- Scope: non-agricultural market sector excluding services to households
- Sources: ACOSS, DARES, INSEE
Wages accelerated in industry and kept on rising firmly in services
In Q1 2018, wages in industry accelerated quarter on quarter (+0.7% after +0.2% in Q4 2017). Year on year, they were a bit less dynamic: +1.8% after +1.9% in the fourth quarter.
Wages in services continued to increase at the same pace in Q1 2018 as in Q4 2017: +0.7% over the quarter and +1.9% over the year. In comparison to the previous quarter, wages slowed down in accommodation and food service activities, in financial and insurance activities and in administrative and support service activities. Conversely, they grew faster in transportation and storage.
Wages in construction declined sharply over the quarter (-1.0% after +1.3%) and slowed down markedly over the year (+1.0% after +3.8% in Q4 2017, the stronger rise for 7 years).
tableauTable1 – LCI - wages & salaries
| Quarterly variations (%) | Annual variations (%) | |||
|---|---|---|---|---|
| Q4-2017 | Q1-2018 | Q4-2017 | Q1-2018 | |
| Industry | 0,2 | 0,7 | 1,9 | 1,8 |
| Mining and quarrying | 1,4 | 0,6 | 2,5 | 2,8 |
| Manufacturing | 0,2 | 0,5 | 1,9 | 1,6 |
| Electricity, gas, steam and air conditioning supply | 0,2 | 2,8 | 2,7 | 4,4 |
| Water supply; sewerage, waste management and remediation activities | 0,4 | 0,2 | 2,1 | 1,7 |
| Services | 0,7 | 0,7 | 1,9 | 1,9 |
| Wholesale and retail trade; repair of motor vehicles and motorcycles | 0,5 | 0,5 | 2,0 | 1,9 |
| Transportation and storage | 0,4 | 0,7 | 1,0 | 1,9 |
| Accommodation and food service activities | 0,8 | 0,3 | 1,6 | 2,0 |
| Information and communication | 1,1 | 1,2 | 3,5 | 2,9 |
| Financial and insurance activities | 1,0 | 0,5 | 2,6 | 2,2 |
| Real estate activities | 1,0 | 0,8 | 3,8 | 2,6 |
| Professional, scientific and technical activities | 0,5 | 0,7 | 2,7 | 1,7 |
| Administrative and support service activities | 1,1 | 0,7 | 1,4 | 1,9 |
| Construction | 1,3 | –1,0 | 3,8 | 1,0 |
| TOTAL | 0,6 | 0,5 | 2,0 | 1,7 |
- Scope: non-agricultural market sector excluding services to households
- Sources: ACOSS, DARES, INSEE
Slight upward revision of LCI – wages and salary in Q4 2017
The Q4 2017 quarterly variation in LCI - wages and salaries in the non-farm business sector has been revised upward by 0.1 percentage points. The year over year variation remained unchanged.
The total labour cost index increased by 1.0%
In the first quarter of 2018, the total labour cost index in the non-farm business sector accelerated over the quarter (+1.0%, after +0.7% – seasonally adjusted data) as well as over the year (+2.3 % after +1.7 %).
Without tax credit for encouraging competitiveness and jobs (CICE), the rise would have been smaller (+1.9%). The rate of CICE has indeed been lowered by 1 percentage point (from 7% to 6%) in metropolitan France since 1st January 2018.
graphiqueGraph2 – LCI - total labour cost: year-on-year changes
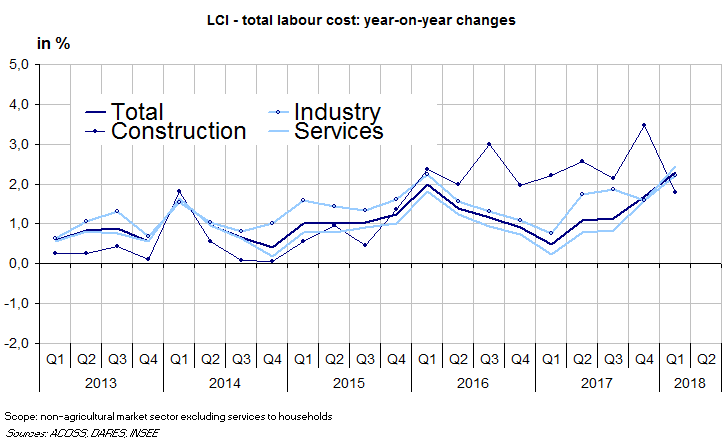
- Scope: non-agricultural market sector excluding services to households
- Sources: ACOSS, DARES, INSEE
Upward revision of LCI – total labour cost in Q1 2018
The Q4 2017 quarter-on-quarter variation in total labour cost index in the non-farm business sector has been revised upward by 0.1 percentage points. The year-over-year variation remained unchanged.
tableauTable2 – LCI - total labour cost
| Quarterly variations (%) | Annual variations (%) | |||
|---|---|---|---|---|
| Q4-2017 | Q1-2018 | Q4-2017 | Q1-2018 | |
| Industry | 0,3 | 1,1 | 1,6 | 2,2 |
| Mining and quarrying | 1,5 | 1,1 | 2,3 | 3,4 |
| Manufacturing | 0,2 | 1,0 | 1,6 | 2,1 |
| Electricity, gas, steam and air conditioning supply | 0,2 | 3,0 | 2,5 | 4,7 |
| Water supply; sewerage, waste management and remediation activities | 0,5 | 0,6 | 1,8 | 2,1 |
| Services | 0,8 | 1,2 | 1,6 | 2,5 |
| Wholesale and retail trade; repair of motor vehicles and motorcycles | 0,6 | 1,1 | 1,6 | 2,7 |
| Transportation and storage | 0,5 | 1,3 | 0,4 | 2,4 |
| Accommodation and food service activities | 1,1 | 1,0 | 1,3 | 3,1 |
| Information and communication | 1,1 | 1,6 | 3,3 | 3,2 |
| Financial and insurance activities | 1,0 | 0,8 | 2,5 | 2,5 |
| Real estate activities | 1,2 | 1,2 | 3,8 | 3,2 |
| Professional, scientific and technical activities | 0,5 | 1,1 | 2,4 | 2,2 |
| Administrative and support service activities | 1,3 | 1,4 | 1,0 | 2,6 |
| Construction | 1,4 | –0,4 | 3,5 | 1,8 |
| TOTAL | 0,7 | 1,0 | 1,7 | 2,3 |
- Scope: non-agricultural market sector excluding services to households
- Sources: ACOSS, DARES, INSEE
tableauTable3 – LCI - total labour cost (without CICE)
| Quarterly variations (%) | Annual variations (%) | |||
|---|---|---|---|---|
| Q4-2017 | Q1-2018 | Q4-2017 | Q1-2018 | |
| Industry | 0,3 | 0,7 | 2,0 | 1,8 |
| Mining and quarrying | 1,5 | 0,6 | 2,7 | 2,9 |
| Manufacturing | 0,2 | 0,5 | 2,0 | 1,6 |
| Electricity, gas, steam and air conditioning supply | 0,2 | 2,8 | 2,7 | 4,5 |
| Water supply; sewerage, waste management and remediation activities | 0,5 | 0,1 | 2,3 | 1,7 |
| Services | 0,8 | 0,8 | 2,0 | 2,0 |
| Wholesale and retail trade; repair of motor vehicles and motorcycles | 0,6 | 0,5 | 2,1 | 2,2 |
| Transportation and storage | 0,5 | 0,8 | 1,0 | 1,8 |
| Accommodation and food service activities | 1,1 | 0,4 | 1,9 | 2,4 |
| Information and communication | 1,1 | 1,3 | 3,5 | 3,0 |
| Financial and insurance activities | 1,0 | 0,6 | 2,7 | 2,3 |
| Real estate activities | 1,2 | 0,9 | 4,1 | 2,9 |
| Professional, scientific and technical activities | 0,5 | 0,8 | 2,7 | 1,9 |
| Administrative and support service activities | 1,3 | 0,8 | 1,6 | 2,0 |
| Construction | 1,4 | –0,9 | 4,0 | 1,2 |
| TOTAL | 0,7 | 0,6 | 2,1 | 1,9 |
- Scope: non-agricultural market sector excluding services to households
- Sources: ACOSS, DARES, INSEE
Pour en savoir plus
