


 30 May 2018
2018- n° 139French GDP slowed down in Q1 2018 (+0.2% after +0.7%) Quarterly national accounts - second estimate - first quarter 2018
30 May 2018
2018- n° 139French GDP slowed down in Q1 2018 (+0.2% after +0.7%) Quarterly national accounts - second estimate - first quarter 2018
In Q1 2018, GDP in volume terms* decelerated: +0.2% after +0.7% in Q4 2017. Household consumption expenditures rose at a slower pace as in Q4 2017 (+0,1% after +0.2%). Total gross fixed capital formation (GFCF: +0.2% after +0.9%) significantly slowed down. Overall, final domestic demand excluding inventory changes slowed down and contributed less to GDP growth: +0.2 points after +0.4 points.
Exports slightly fell back (−0.3% after +2.3%) as well as imports (−0.3% after +0.1%). All in all, foreign trade balance didn't contribute to GDP growth in Q1. Similarly, changes in inventories were stable and therefore did not contribute to GDP growth
graphiqueGraph – GDP and its main components
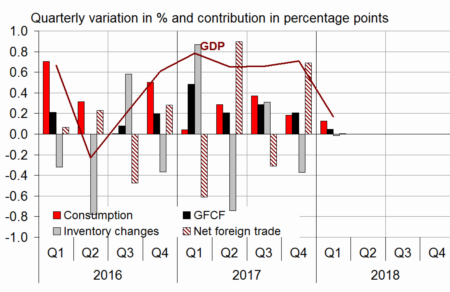
- Source: INSEE
tableauTab1 – GDP and its main components: chain-linked volumes
| 2017 Q2 | 2017 Q3 | 2017 Q4 | 2018 Q1 | 2017 | 2018 (ovhg) | |
|---|---|---|---|---|---|---|
| GDP | 0.7 | 0.7 | 0.7 | 0.2 | 2.3 | 1.2 |
| Imports | -0.1 | 1.8 | 0.1 | -0.3 | 4.1 | 0.6 |
| Household consumption *expenditure | 0.3 | 0.5 | 0.2 | 0.1 | 1.1 | 0.6 |
| General government's *consumption expenditure | 0.5 | 0.5 | 0.3 | 0.3 | 1.4 | 0.9 |
| GFCF | 0.9 | 1.3 | 0.9 | 0.2 | 4.7 | 1.8 |
| *of which Non-financial corporated and unincorporated enterprises | 0.6 | 1.5 | 1.2 | 0.1 | 4.4 | 2.0 |
| Households | 1.5 | 1.0 | 0.6 | 0.2 | 5.6 | 1.6 |
| General government | 0.4 | 0.3 | 0.4 | 0.5 | 1.6 | 1.1 |
| Exports | 2.8 | 0.8 | 2.3 | -0.3 | 4.7 | 2.5 |
| Contributions: | ||||||
| Internal demand excluding inventory changes | 0.5 | 0.7 | 0.4 | 0.2 | 2.0 | 0.9 |
| Inventory changes | -0.7 | 0.3 | -0.4 | 0.0 | 0.2 | -0.3 |
| Net foreign trade | 0.9 | -0.3 | 0.7 | 0.0 | 0.1 | 0.6 |
- Source: INSEE
Total production decelerated
Production in goods and services slowed down in Q1 2018 (+0.1% after +1.0%). It fell back markedly in goods (−0.6% after +1.1%) while it continued to grow at a sustained pace in services (+0.4% after +0.9%).
Output in manufactured goods fell back (−1.0% after +1.3%), mainly owing to a significant decrease in transport equipment and, to a lesser extent, in production of construction. Conversely, production in electricity and gas picked up (+1.4% after +0.1%).
tableauTab2 – Production, consumption and GFCF: main components
| 2017 Q2 | 2017 Q3 | 2017 Q4 | 2018 Q1 | 2017 | 2018 (ovhg) | |
|---|---|---|---|---|---|---|
| Production of branches | 0.7 | 0.8 | 1.0 | 0.1 | 2.6 | 1.4 |
| Goods | 0.7 | 1.0 | 1.1 | -0.6 | 2.2 | 0.9 |
| Manufactured Industry | 0.6 | 1.0 | 1.3 | -1.0 | 2.4 | 0.6 |
| Construction | 1.1 | 0.6 | 0.5 | -0.1 | 3.5 | 0.8 |
| Market services | 0.8 | 0.8 | 1.1 | 0.5 | 3.2 | 1.9 |
| Non-market services | 0.4 | 0.5 | 0.4 | 0.3 | 1.1 | 0.9 |
| Household consumption | 0.3 | 0.5 | 0.2 | 0.1 | 1.1 | 0.6 |
| Food products | 0.7 | -0.5 | 0.1 | -0.3 | 0.3 | -0.3 |
| Energy | 0.9 | 1.6 | -0.5 | 0.7 | 0.1 | 1.3 |
| Engineered goods | 0.7 | 1.1 | -0.1 | -0.3 | 2.6 | 0.3 |
| Services | 0.3 | 0.5 | 0.5 | 0.4 | 1.6 | 1.1 |
| GFCF | 0.9 | 1.3 | 0.9 | 0.2 | 4.7 | 1.8 |
| Manufactured goods | 0.3 | 1.7 | 1.6 | -1.3 | 3.7 | 0.8 |
| Construction | 1.2 | 0.7 | 0.3 | 0.3 | 3.5 | 1.2 |
| Market services | 1.0 | 1.7 | 1.2 | 1.0 | 7.0 | 3.1 |
- Source: INSEE
Household consumption remained sluggish
Household consumption expenditure continued to be sluggish in Q1 2018 (+0.1% after +0.2%): consumption of goods slightly diminished for the second consecutive quarter while that of services slowed down slightly (+0.4% after +0.5%).
Particularly, consumption of food products declined (−0.3% after +0.1%) while expenditure on energy bounced back (+0.7% after −0.5%) because of temperatures lower than the seasonal norms in February and March.

* This growth rate is seasonally and working-day adjusted; volumes are chain-linked previous-year-prices volumes.
tableauTab3 – Sectoral accounts
| 2017 Q2 | 2017 Q3 | 2017 Q4 | 2018 Q1 | 2016 | 2017 | |
|---|---|---|---|---|---|---|
| Profit ratio of NFCs* (level) | 31.9 | 32.1 | 32.1 | 31.8 | 32.0 | |
| Households' purchasing power | 0.6 | 0.4 | 0.1 | 1.8 | 1.4 |
- *NFCs: non-financial corporations
- Source: INSEE
tableauTab4 – Households' disposable income and ratios of households' account
| 2017 Q2 | 2017 Q3 | 2017 Q4 | 2018 Q1 | 2016 | 2017 | |
|---|---|---|---|---|---|---|
| HDI | 0.6 | 0.6 | 0.6 | 1.7 | 2.7 | |
| Household purchasing power | 0.6 | 0.4 | 0.1 | 1.8 | 1.4 | |
| HDI by cu* (purchasing power) | 0.5 | 0.3 | 0.0 | 1.2 | 0.9 | |
| Adjusted HDI (purchasing power) | 0.5 | 0.5 | 0.2 | 1.8 | 1.5 | |
| Saving rate (level) | 14.3 | 14.3 | 14.2 | 14.0 | 14.2 | |
| Financial saving rate (level) | 4.3 | 4.4 | 4.4 | 4.5 | 4.4 |
- *cu: consumption unit
- Source: INSEE
Corporate investment and househould investment slowed down
In Q1 2018, total GFCF increased at a lower pace (+0.2% after +0.9 in Q4 2017), especially because of the slowdown in corporate investment (+0.1% after +1.2%). It was mainly due to the decline in manufactured goods (−1.3% after +1.6%). Household investment decelerated as well (+0.2% after +0.6%) because of the slowdown in construction.
tableauTab5 – Ratios of non-financial corporations' account
| 2017 Q2 | 2017 Q3 | 2017 Q4 | 2018 Q1 | 2016 | 2017 | |
|---|---|---|---|---|---|---|
| Profit share | 31.9 | 32.1 | 32.1 | 31.8 | 32.0 | |
| Investment ratio | 23.4 | 23.5 | 23.6 | 23.2 | 23.5 | |
| Savings ratio | 22.4 | 23.0 | 22.5 | 21.5 | 22.5 | |
| Self-financing ratio | 95.9 | 97.7 | 95.3 | 92.5 | 95.9 |
- Source: INSEE
Foreign trade balance contribution on GDP growth was null
Exports slightly diminished in Q1 2018 after the marked dynamism observed in Q4 2017 (−0.3% after +2.3%), especially in transport equipment. At the same time, imports lightly decreased (−0.3% after +0.1%). All in all, foreign trade balance did not contribute to GDP growth, after a contribution of +0.7 points in the previous quarter.
tableauTab6 – Expenditure, receipts and net borrowing of public administrations)
| 2017 Q2 | 2017 Q3 | 2017 Q4 | 2018 Q1 | 2016 | 2017 | |
|---|---|---|---|---|---|---|
| In billions of euros | ||||||
| Total expenditure | 321.1 | 324.6 | 327.6 | 1260.7 | 1292.5 | |
| Total receipts | 307.2 | 309.1 | 314.1 | 1184.8 | 1232.8 | |
| Net lending (+) or borrowing (–) | -13.9 | -15.5 | -13.5 | -75.9 | -59.7 | |
| In % of GDP | ||||||
| Net lending (+) or borrowing (–) | -2.4 | -2.7 | -2.3 | -3.4 | -2.6 |
- Source: INSEE
Revisions
The extent of the revisions compared to the previous estimate is typical at this time of year: it results from the benchmarking on the annual accounts revised on years 2015 to 2017 and from the updates of seasonal and working day adjustments as well as revision of indicators. Furthermore, quarterly and annual national accounts switched to “base 2014” which constitutes an other source of revision.
The GDP growth for Q1 2018 is lowered from +0.3% to +0.2%.
Pour en savoir plus
Time series: Operations on goods an services
Time series: Gross domestic product balance
Time series: Institutional sector accounts
Time series: Branch accounts
