


 23 May 2018
2018- n° 129The unemployment rate increased by 0.2 points in Q1 2018, after having decreased by
0.7 points in Q4 2017 ILO Unemployment and Labour Market-related indicators (Labour Force Survey results)
- first quarter 2018
23 May 2018
2018- n° 129The unemployment rate increased by 0.2 points in Q1 2018, after having decreased by
0.7 points in Q4 2017 ILO Unemployment and Labour Market-related indicators (Labour Force Survey results)
- first quarter 2018
On average in Q1 2018, the average ILO unemployment rate in metropolitan France and the overseas departments (excluding Mayotte) stood at 9.2% of the labour force, after 9.0% in Q4 2017. It increased by 0.2 percentage points quarter on quarter, after having decreased by 0.7 points in Q4 2017. Over a year, the unemployment rate fell by 0.4 points.
In metropolitan France, the number of unemployed increased by 83,000 in early 2018 to 2.6 million people; thus, the unemployment rate increased by 0.3 points compared to Q4 2017, standing at 8.9% of the labour force. The employment rate was stable and the activity rate increased by 0.2 points. The unemployment rate increased across all age groups, particularly among women aged 15 to 49.
Long-term unemployment was almost steady
Among the unemployed, 1.1 million declared that they had been seeking a job for at least one year. The long-term unemployment rate stood at 3.6% of the labour force. This rate was almost steady compared to Q4 2017 (–0.1 points) and decreased by 0.5 points year on year.
graphiqueGraph1 – ILO-unemployment rate
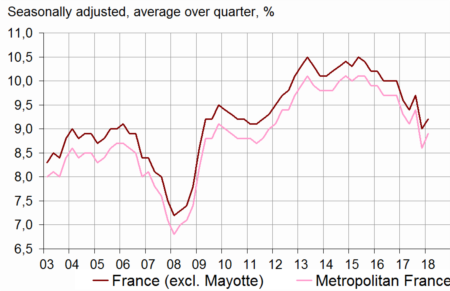
- Estimation within +/-0.3 point of the level of unemployment rate and of its quarterly variations
- Scope: population of people living in households, people aged 15 years or more
- Source: INSEE, Labour Force Survey
tableauTable1 – ILO-unemployment rate in metropolitan France
| ILO-unemployment rate (%) | Variation in points | Thousands | |||
|---|---|---|---|---|---|
| 2017Q4 | 2018Q1 (p) | over quarter | over year | 2018Q1 (p) | |
| Unemployed persons | 8.6 | 8.9 | 0.3 | –0.4 | 2,586 |
| 15-24 years | 20.6 | 20.8 | 0.2 | –1.0 | 576 |
| 25-49 years | 8.0 | 8.3 | 0.3 | –0.3 | 1,470 |
| 50 years and more | 6.1 | 6.3 | 0.2 | –0.3 | 540 |
| Men | 8.8 | 8.8 | 0.0 | –0.4 | 1,329 |
| 15-24 years | 21.2 | 20.5 | –0.7 | –2.2 | 313 |
| 25-49 years | 7.8 | 7.9 | 0.1 | –0.4 | 722 |
| 50 years and more | 6.6 | 6.7 | 0.1 | 0.0 | 294 |
| Women | 8.4 | 9.0 | 0.6 | –0.3 | 1,257 |
| 15-24 years | 19.9 | 21.1 | 1.2 | 0.3 | 263 |
| 25-49 years | 8.1 | 8.8 | 0.7 | –0.2 | 748 |
| 50 years and more | 5.7 | 5.8 | 0.1 | –0.8 | 246 |
| Long-term unemployed persons | 3.7 | 3.6 | –0.1 | –0.5 | 1,060 |
- (p) = provisional results
- Scope : population of people living in households, people aged 15 years or more in metropolitan France
- Source: INSEE, Labour Force Survey
In metropolitan France, among inactive people as defined by the ILO, 1.5 million persons wished to work without being considered as unemployed according to the ILO definition: they made up the halo of unemployment. Their number fell by 22,000 in Q1 2018 and was almost steady year on year (–10,000).
graphiqueGraph2 – People in the halo of unemployment
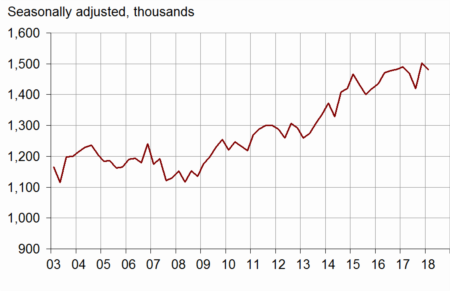
- Scope: population of people living in households in metropolitan France, people aged 15 years or over
- Source: INSEE, Labour Force Survey
The employment rate was stable in Q1 2018, at its highest level since the early 1980s
The employment rate of the population aged 15-64 years remained at 65.7% in Q1 2018, as in Q4 2017 and at its highest level since the early 1980s. It rose by 1.0 percentage points year on year. It increased slightly for persons aged 50 to 64 and was almost stable among other age groups.
Full-time employment rate remained at 53.9% in Q1 2018. It increased by 0.9 percentage points compared to Q1 2017. Part-time employment rate stood at 11.8%, the same level as in Q4 2017, and close to its Q1 2017 level (+0.1 points).
Permanent employment rate for people aged 15 to 64 stood at 49.2% in Q1 2018, slightly above its Q4 2017 level (+0.1 points). It increased by 0.6 points over a year. Fixed-term and temporary employment rate stood at 8.0%, close to its Q4 2017 level (–0.1 points). It rose by 0.2 points compared to Q1 2017.
In Q1 2018, 6.0% of the employed persons were underemployed, which mainly concerns people who have a part-time job and wish to work more. This ratio increased by 0.4 points compared to Q4 2017, and was almost steady year on year (–0.1 points).
tableauTable2 – ILO employment rate in the population aged 15-64 years
| % of people in the age group | Variation in points over | |||
|---|---|---|---|---|
| 2017Q4 | 2018Q1 (p) | quarter | year | |
| Employed people | 65.7 | 65.7 | 0.0 | 1.0 |
| Men | 69.3 | 69.4 | 0.1 | 1.0 |
| Women | 62.2 | 62.2 | 0.0 | 0.9 |
| 15-24 years | 29.9 | 29.8 | –0.1 | 1.2 |
| 25-49 years | 81.0 | 81.0 | 0.0 | 0.8 |
| 50-64 years | 62.1 | 62.4 | 0.3 | 1.5 |
| Included : 55-64 years | 52.2 | 52.3 | 0.1 | 1.5 |
| Permanent employment | 49.1 | 49.2 | 0.1 | 0.6 |
| Fixed-term and temporary employment | 8.1 | 8.0 | –0.1 | 0.2 |
| Full-time employment | 53.9 | 53.9 | 0.0 | 0.9 |
| Part-time employment | 11.8 | 11.8 | 0.0 | 0.1 |
| Full-time equivalent employment rate | 60.9 | 60.9 | 0.0 | 0.9 |
- (p) = provisional results
- Scope: population of people living in households in metropolitan France, people aged 15-64 years
- Source: INSEE, Labour Force Survey
graphiqueGraph3 – Permanent and temporary/fixed-term employment rate in the population aged 15-64 years

- Scope: population of people living in households in metropolitan France, people aged 15-64 years
- Source: INSEE, Labour Force Survey
The activity rate increased by 0.2 points
The activity rate of people aged 15-64 stood at 72.2% in Q1 2018. It increased by 0.2 percentage points quarter-on-quarter and by 0.8 percentage points compared to Q1 2017.
tableauTable3 – ILO activity rate in the population aged 15-64 years
| % of people in the age group | Variation in points over | |||
|---|---|---|---|---|
| 2017Q4 | 2018Q1 (p) | quarter | year | |
| Active people | 72.0 | 72.2 | 0.2 | 0.8 |
| Men | 76.1 | 76.2 | 0.1 | 0.9 |
| Women | 68.0 | 68.4 | 0.4 | 0.8 |
| 15-24 years | 37.6 | 37.7 | 0.1 | 1.1 |
| 25-49 years | 88.0 | 88.4 | 0.4 | 0.6 |
| 50-64 years | 66.3 | 66.6 | 0.3 | 1.3 |
| Included : 55-64 years | 55.6 | 56.0 | 0.4 | 1.6 |
- (p) = provisional results
- Scope: population of people living in households in metropolitan France, people aged 15-64 years
- Source: INSEE, Labour Force Survey
Revisions
Compared to the provisional estimate published on 15 February 2017, the ILO unemployment rate in Q4 2017 has been upgraded by 0.1 percentage points in France (from 8.9 % to 9.0 %), due to seasonal adjustment coefficients recalculation. It is unchanged for metropolitain France. From this release on, results of the Labour Force Survey will not include those of the survey of non-respondents (see Abbreviated Methodology).
Pour en savoir plus
