


 24 April 2018
2018- n° 105In April 2018, the business climate weakens again in retail trade and in trade and
repair of motor vehicles Monthly survey of retailing - April 2018
24 April 2018
2018- n° 105In April 2018, the business climate weakens again in retail trade and in trade and
repair of motor vehicles Monthly survey of retailing - April 2018
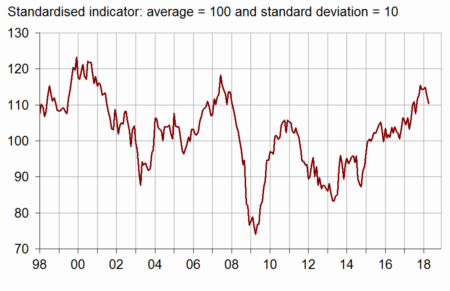
According to the managers in retail trade and in trade and repair of motor vehicles, the business climate has weakened again in April 2018 but remains at a high level. The composite indicator that measures it has lost three points, to 110. However, it remains markedly above its long-term average (100), that it has reached or exceeded since February 2015.
According to the managers in retail trade and in trade and repair of motor vehicles, the business climate has weakened again in April 2018 but remains at a high level. The composite indicator that measures it has lost three points, to 110. However, it remains markedly above its long-term average (100), that it has reached or exceeded since February 2015.
graphiqueChart_1 – Business climate synthetic indicator
Less optimistic general business outlook
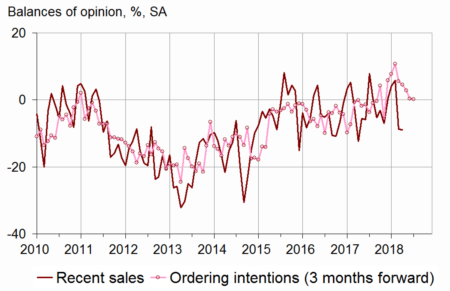
Managers' opinions about their recent sales have stabilized after a steep fall in March. The corresponding balance remains negative and below its average. Their anticipations about their sales and their orders are also stable. Nevertheless, the balance on general business outlook has been slowly declining since January. Each of these three balances remains above its long-term average.
The balance concerning stocks has been slowly rising for four months: stocks have been mostly deemed above their standard level.
The balance on expected prices is stable and close to its average.
tableauTable_1 – Tendency in retail trade and in trade and repair of motor vehicles
| Ave. (1) | Jan. 18 | Feb. 18 | Mar. 18 | Apr. 18 | |
|---|---|---|---|---|---|
| Business climate | 100 | 114 | 115 | 113 | 110 |
| General business outlook | –29 | 3 | 1 | 0 | –4 |
| Recent sales | –6 | 4 | 6 | –9 | –9 |
| Expected sales | –2 | 10 | 10 | 5 | 5 |
| Ordering intentions | –8 | 5 | 3 | 0 | 0 |
| Stocks | 11 | 12 | 14 | 15 | 16 |
| Past selling prices (2) | –6 | 3 | –1 | ||
| Expected selling prices | –3 | –1 | 2 | –2 | –2 |
| Cash position (2) | –15 | –15 | –17 | ||
| Workforce size: recent trend | 1 | 5 | 6 | 6 | 3 |
| Workforce size: future trend | –3 | –1 | 1 | 1 | –1 |
- (1) Average since 1991 (2004 for recent and expected sales and ordering intentions).
- (2) Bi-monthly question (odd-numbered months).
- Source: INSEE - monthly survey in retail trade and in trade and repair of motor vehicles
graphiqueChart_2 – Recent sales and ordering intentions
The balances on employment have declined in retail trade
The balances on past and expected employment have declined due to the retail trade. In fact, in trade and repair of motor vehicles, the balances have slightly increased, the one about expected workforce reaching its highest point since the beginning of the survey in this sector in February 2003. They all remain above their average, except the one on expected employment in retail trade which has moved below it.
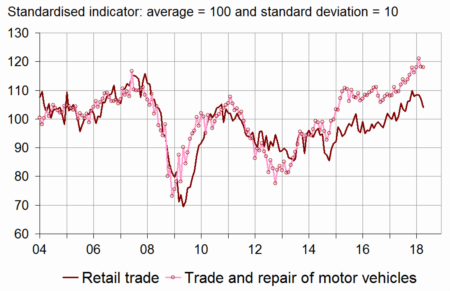
In retail trade, the business climate has deteriorated again
In retail trade, the business climate has deteriorated again. The composite indicator that measures it has lost three points, to 104. Nevertheless, it has remained above its average (100), as since May 2017.
The balances concerning non-specialised as specialised trade have barely changed and remain below their mean level.
For the next three months, fewer non-specialised retailers than in March have expected a rise in their sales and their orders, unlike specialised retailers. In the whole retail trade, the balance on general business outlook has declined for the fourth month in a row.
The balance on expected prices is practically stable, close to its average.
In trade and repair of motor vehicles, the business climate is stable at a very high level
In trade and repair of motor vehicles and motor cycles, the business climate is stable. It remains very high (118), standing above its average (100) since January 2015.
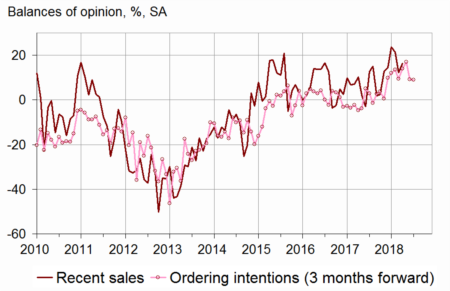
The balances concerning past and expected sales have recovered. The one about ordering intentions is stable. However, the one on general business outlook has significantly fallen back. Each of the four balances has stood well above its average.
Stocks have been estimated larger once again. The corresponding balance is higher than it has been since August 2012.
The balance about expected prices has picked up, returning above its average.
graphiqueChart_3 – Recent sales and ordering intentions in trade and repair of motor vehicles
graphiqueChart_4 – Business climate synthetic indicator in retail trade and in trade and repair of motor vehicles
tableauTable_2 – Detailed data
| Ave. (1) | Jan. 18 | Feb. 18 | Mar. 18 | Apr. 18 | |
|---|---|---|---|---|---|
| Retail trade - Global data | |||||
| Business climate | 100 | 108 | 108 | 107 | 104 |
| Gener. busin. outlook | –29 | –1 | –2 | –4 | –6 |
| Recent sales | –6 | –4 | –1 | –18 | –20 |
| Expected sales | 0 | 5 | 4 | 4 | 3 |
| Ordering intentions | –6 | –1 | –4 | –4 | –3 |
| Stocks | 10 | 11 | 12 | 13 | 12 |
| Past selling prices (2) | –8 | 3 | –6 | ||
| Expected selling prices | –5 | –7 | –1 | –5 | –6 |
| Cash position (2) | –13 | –16 | –15 | ||
| Workforce size: recent trend | 2 | 4 | 5 | 7 | 3 |
| Workforce size: future trend | –2 | 0 | 0 | –1 | –3 |
| Non-specialised retail trade | |||||
| Recent sales | –2 | 1 | 1 | –20 | –21 |
| Expected sales | 7 | 8 | 7 | 14 | 6 |
| Ordering intentions | 2 | 5 | 1 | 3 | –4 |
| Stocks | 7 | 7 | 9 | 9 | 11 |
| Past selling prices (2) | –8 | 16 | –3 | ||
| Expected selling prices | –5 | –8 | 2 | –3 | –1 |
| Cash position (2) | –7 | –10 | –7 | ||
| Specialised retail trade | |||||
| Recent sales | –12 | –11 | –4 | –16 | –20 |
| Expected sales | –8 | 1 | 1 | –6 | –2 |
| Ordering intentions | –16 | –8 | –9 | –9 | –4 |
| Stocks | 13 | 17 | 17 | 19 | 14 |
| Past selling prices (2) | –8 | –10 | –10 | ||
| Expected selling prices | –5 | –7 | –4 | –7 | –11 |
| Cash position (2) | –22 | –22 | –25 | ||
| Trade and repair of motor cars and motorcycles | |||||
| Business climate | 100 | 118 | 121 | 118 | 118 |
| Gener. busin. outlook | –26 | 16 | 11 | 14 | 6 |
| Recent sales | –7 | 24 | 21 | 12 | 16 |
| Expected sales | –6 | 19 | 22 | 4 | 7 |
| Ordering intentions | –10 | 14 | 17 | 9 | 9 |
| Stocks | 15 | 13 | 17 | 22 | 25 |
| Past selling prices (2) | 1 | 2 | 10 | ||
| Expected selling prices | 4 | 3 | 9 | 3 | 6 |
| Cash position (2) | –23 | –12 | –20 | ||
| Workforce size: recent trend | –8 | 5 | 6 | 0 | 3 |
| Workforce size: future trend | –6 | –5 | 7 | 8 | 10 |
- (1) Average since 1991 (2003 for trade and repair of motor vehicles and 2004 for recent and expected sales and ordering intentions).
- (2) Bi-monthly question (odd-numbered months).
- Source: INSEE - monthly survey in retail trade and in trade and repair of motor vehicles
Documentation
Methodology (pdf,129 Ko)
Pour en savoir plus
