


 18 April 2018
2018- n° 100In March, oil price increased moderatly; industrial raw materials prices clearly contracted Prices of oil and raw material imports - March 2018
18 April 2018
2018- n° 100In March, oil price increased moderatly; industrial raw materials prices clearly contracted Prices of oil and raw material imports - March 2018
In March 2018, the price of crude oil in euros increased moderately (+1.4% after −6.6% in Februray). The prices in euros of all other imported commodities fell back (−1.4% after +0.3%). The prices of industrial raw materials decreased remarkably (−4.5% after −0.4%) while the prices of raw food materials increased (+2.1% after +1.0%).
In March 2018, the price of crude oil in euros increased moderately (+1.4% after −6.6% in Februray). The prices in euros of all other imported commodities fell back (−1.4% after +0.3%). The prices of industrial raw materials decreased remarkably (−4.5% after −0.4%) while the prices of raw food materials increased (+2.1% after +1.0%).
Oil price increased moderatly
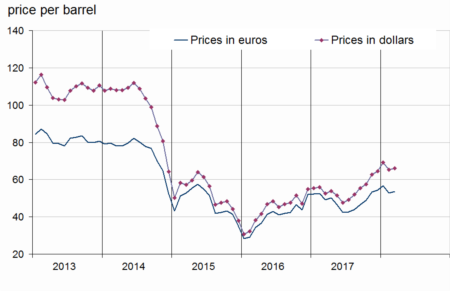
In March 2018, the price of North Sea crude oil (Brent) in euros increased slightly (+1.4% after −6.6% in February) to an average of €54 per barrel. In dollars, the decrease was less marked in March (+1.3% after −5.4%).
tableauTable1 – Oil and petroleum products
| Prices | Change (%) | |||
|---|---|---|---|---|
| of last month | over the last month | over the last 3 months | over the last 12 months | |
| Brent in $ per barrel | 66.2 | 1.3 | 2.8 | 25.9 |
| Brent in € per barrel | 53.6 | 1.4 | –1.4 | 9.0 |
| Gasoline cts €/L | 38.9 | 0.0 | –0.9 | 5.5 |
| Gas Oil | 475.8 | 1.5 | –1.2 | 9.4 |
| Heavy fuel | 306.2 | –4.6 | –4.2 | 3.6 |
| Naphtha | 457.7 | 2.1 | –5.3 | 5.8 |
- Prices are in euros per tonne unless otherwise specified
- Source: INSEE
Industrial commodity prices decreased remarkably
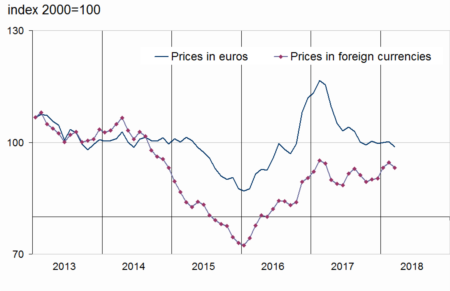
In March 2018, the prices in euros of industrial raw materials strongly decreased (−4.5% after −0.4%). The prices of minerals decreased clearly (−5.8% after −0.8%), largely due to prices retreat in non-ferrous metals (−4.4% after −1.3%) and ferrous metals (−8.6% after +0.1%), in a context of import taxes introduction by the United States on aluminium and steel. However, the prices of precious metals decreased less than in February (−0.9% after −2.4%) The prices of agro-industrial raw materials increased again (+1.3% after +1.5%). The prices of natural fibres bounced back (+3.2% after −0.7%)%), while wood pulp price kept rising (+2.6% after +2.3%). The price of tropical wood remained virtually stable again (0.0% after +0.1%). The price of hide decreased less clearly than in February (−0.5% after −1.1%), such as natural rubber price (−1.2% after −4.3%). The price of sawn softwood eased (+0.5% after +4.5%).
Food commodity prices increased
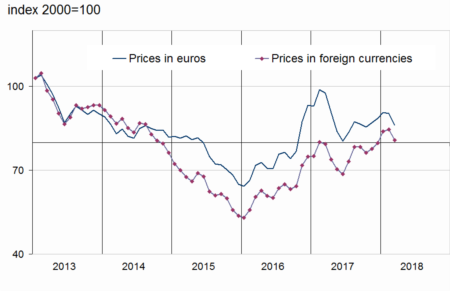
In euros, the prices of raw food materials accelerated (+2.1% after +1.0%). The rise in tropical foodstuffs prices was exacerbated (+3.2% after +0.6%). The prices of seafood products bounced back (+5.8% after −3.1%), as those of cereals (+2.7% after −0.6%). The prices of meat increased less strongly than in February (+0.5% after +5.7%). Those of oil seeds and vegetable oils fell back (−0.6% after +2.5%). The price of sugar kept decreasing (−5.2% after −4.4%).
tableauTable2 – Imported raw materials (excluding energy) in euros
| Index | Changes (%) | |||
|---|---|---|---|---|
| of last month | over the last month | over the last 3 months | over the last 12 months | |
| Food total | 114.4 | 2.1 | 1.0 | –17.1 |
| Tropical foodstuffs | 94.1 | 3.2 | 2.8 | –18.6 |
| Oil seeds, vegetable oils | 109.3 | –0.6 | –0.6 | –10.2 |
| Cereals | 94.6 | 2.7 | 5.4 | –3.4 |
| Sugar | 62.1 | –5.2 | –14.7 | –37.4 |
| Meat | 139.5 | 0.5 | 1.9 | –11.2 |
| Seafood products | 111.8 | 5.8 | 1.3 | –25.7 |
| Industrial raw materials | 86.2 | –4.5 | –2.7 | –11.7 |
| Agricultural raw materials | 119.5 | 1.3 | 3.3 | 3.0 |
| Natural Fibres | 102.7 | 3.2 | 5.2 | –1.0 |
| Natural rubber | 46.4 | –1.2 | –4.3 | –36.7 |
| Hide | 79.5 | –0.5 | –1.4 | –25.9 |
| Wood pulp | 125.7 | 2.6 | 5.3 | 14.3 |
| Tropical wood | 96.3 | 0.0 | 0.0 | –1.9 |
| Sawn softwood | 221.2 | 0.5 | 9.2 | 26.4 |
| Minerals | 80.0 | –5.8 | –4.0 | –14.6 |
| Ferrous metals | 53.8 | –8.6 | –5.9 | –29.7 |
| Non-ferrous metals | 102.4 | –4.4 | –2.3 | –1.4 |
| Precious metals | 103.4 | –0.9 | –1.1 | –10.3 |
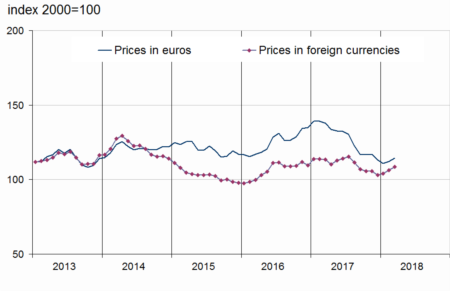
| All commodities | 98.8 | –1.4 | –0.9 | –14.4 |
- Source: INSEE
graphiqueGraph1 – Oil (Brent)
- Source : INSEE
graphiqueGraph3 – Food
- Source : INSEE
graphiqueGraph2 – Imported raw materials (excluding energy)
- Source : INSEE
graphiqueGraph4 – Industrial raw materials
- Source : INSEE
Pour en savoir plus
Time series : Raw materials prices
