


 22 March 2018
2018- n° 73In March 2018, the business climate improves slightly in the building construction
industry Monthly survey of building - March 2018
22 March 2018
2018- n° 73In March 2018, the business climate improves slightly in the building construction
industry Monthly survey of building - March 2018
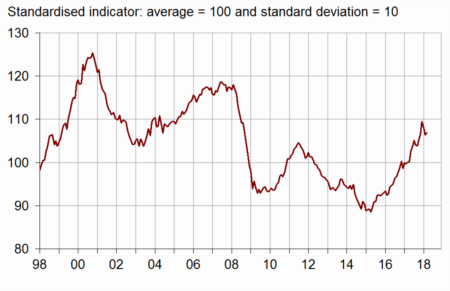
According to the business managers in the building construction industry surveyed in March 2018, the business climate has improved slightly. After losing two points in February, the composite indicator has increased by one point and stands at 107, well above its long-term average (100).
Otherwise, the business climate in February 2018 has been revised downward by one point due to late responses of businesses.
- Business managers are more optimistic on their activity over the next three months
- Many more business managers have reported an increase in their past and expected staff size
- Order books are judged a little less filled
- Production capacity remains more used than on average
- Prices mostly expected to rise
According to the business managers in the building construction industry surveyed in March 2018, the business climate has improved slightly. After losing two points in February, the composite indicator has increased by one point and stands at 107, well above its long-term average (100).
Otherwise, the business climate in February 2018 has been revised downward by one point due to late responses of businesses.
graphiqueGraph1 – Business climate composite indicator
The turning point indicator has left the unfavourable area and has gone into the uncertainty area.
graphiqueGraph2 – Turning-point indicator
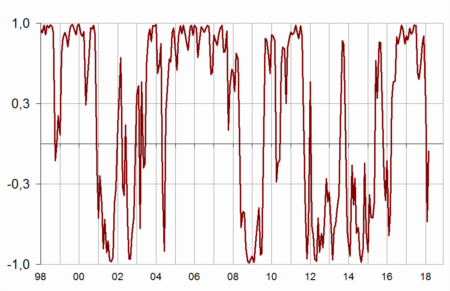
- Note: close to 1 (respectively –1), it indicates a favourable climate (respectively unfavourable). The uncertainty area is between –0.3 and +0.3
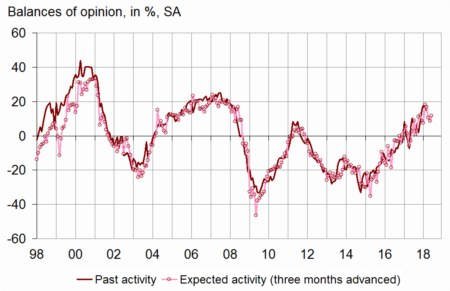
Business managers are more optimistic on their activity over the next three months
In March 2018, fewer business managers than in the previous month have indicated an increase in their activity over the last three months. The corresponding balance has decreased again while remaining far above its long-term average. However, the balance of opinion on expected activity has bounced back after three consecutive months of decrease. It stands well above its long-term average.
graphiqueGraph3 – Activity tendency in building construction
tableauTable1 – Building industry economic outlook
| Mean* | Dec. 17 | Jan. 18 | Feb. 18 | March 18 | |
|---|---|---|---|---|---|
| Composite indicator | 100 | 109 | 108 | 106 | 107 |
| Past activity | –4 | 15 | 18 | 16 | 14 |
| Expected activity | –6 | 17 | 11 | 9 | 12 |
| Gen. business outlook | –17 | 22 | |||
| Past employment | –6 | 6 | –2 | –5 | –1 |
| Expected employment | –4 | 12 | 9 | 4 | 12 |
| Opinion on order books | –24 | –11 | –10 | –14 | –15 |
| Order books (in month) | 5.5 | 7.5 | 7.2 | 7.4 | 7.4 |
| Production capacity utilisation rate | 88.5 | 89.7 | 89.5 | 89.1 | 88.9 |
| Obstacles to production increase (in %) | 32 | 35 | 35 | 32 | 32 |
| - Because of workforce shortage (in %) | 13.7 | 11.7 | 11.8 | 11.3 | 12.4 |
| Recruiting problems (in %) | 57 | 61 | |||
| Expected prices | –15 | 1 | 8 | 3 | 4 |
| Cash-flow position | –10 | –13 | |||
| Repayment period | 29 | 30 |
- * Mean since April 1975 for the composite indicator and since
- September 1993 for the balances of opinion.
- Source: INSEE, business tendency survey in the building industry
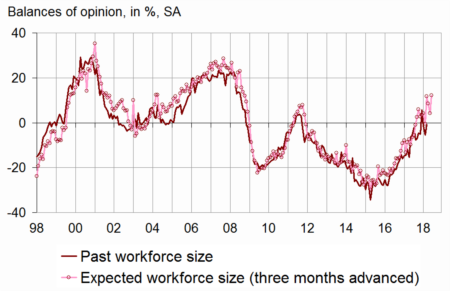
Many more business managers have reported an increase in their past and expected staff size
In March 2018, many more business managers than in February have reported an increase in their staff size over the last three months. The corresponding balance has picked up and stands well above its long-term average. Likewise, employment prospects are judged much more favourable than in the previous month. The balance of opinion on expected staff size has bounced back markedly and has returned to its high level of the end of 2017, well above its long-term average.
graphiqueGraph4 – Workforce size tendency in building construction
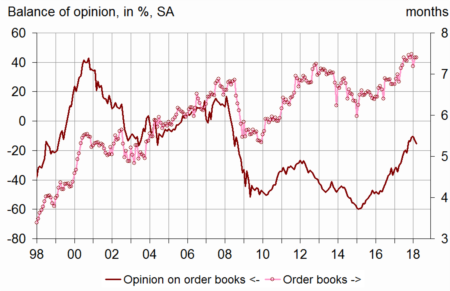
Order books are judged a little less filled
In March 2018, slightly fewer business managers than in the previous month consider that their order books are well filled for the period. The corresponding balance of opinion has decreased slightly after a sharper decline in the previous month; it remains well above its long-term average. With their present staff size, business managers consider that their order books provide 7.4 months of work, the same level as last month and clearly more than on long-term average (5.5 months).
graphiqueGraph5 – Order books
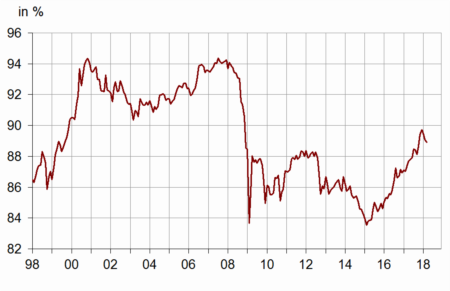
Production capacity remains more used than on average
In March 2018, the production capacity utilisation rate has decreased slightly for the third consecutive month. At 88.9%, it remains above its long-term average (88.5%). At the same time, 32% of business managers have reported production bottlenecks, as many as in the previous month and as on long-term average. However, slightly more business managers than in February have reported production bottlenecks because of workforce shortage (12.4%), this share remaining nevertheless below its long-term average (13.7%).
graphiqueGraph6 – Production capacity utilisation rate
Prices mostly expected to rise
In March 2018, roughly as many business managers as in February have indicated that they will increase their prices over the next three months. After slipping back in February, the corresponding balance is virtually stable, well above its long-term average.
Documentation
Abbreviated methodology (pdf,177 Ko)
Pour en savoir plus
