


 22 February 2018
2018- n° 46In January 2018, consumer prices decline by 0.1% over a month and up 1.3% year on
year Consumer price index - final results - January 2018
22 February 2018
2018- n° 46In January 2018, consumer prices decline by 0.1% over a month and up 1.3% year on
year Consumer price index - final results - January 2018
In January 2018, the Consumer Prices Index (CPI) edged down by 0.1%, following a +0.3% rebound in December. This decline is largely the result of a seasonal downturn in manufactured product prices due to winter sales, and a drop in transport prices. Tobacco prices fell also. The monthly downturn was mitigated by a sharp acceleration in energy prices and a rise in food prices.
Monthly change: -0.1% in January; Year-on-year change: +1.3%
In January 2018, the Consumer Prices Index (CPI) edged down by 0.1%, following a +0.3% rebound in December. This decline is largely the result of a seasonal downturn in manufactured product prices due to winter sales, and a drop in transport prices. Tobacco prices fell also. The monthly downturn was mitigated by a sharp acceleration in energy prices and a rise in food prices.
Seasonally adjusted, consumer prices accelerated (+0.7%) after +0.1% in December.
Year on year, consumer prices rose by 1.3% in January after +1.2% in November and December. The acceleration in energy and services prices was partly offset by slower prices of tobacco and food products. Prices of manufactured products were stable.
Increase in core inflation year on year
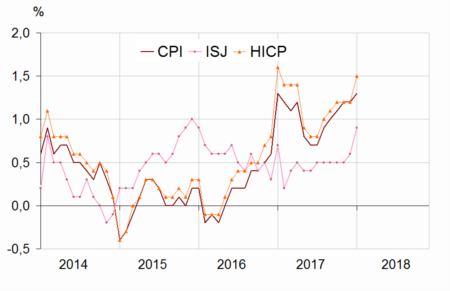
In January 2018, the core inflation index (ISJ) rose by 0.6% after a stability in December. Year on year, core inflation accelerated to +0.9%, after +0.6% in the previous month. The Harmonised Index of Consumer Prices (HICP) fell slightly (−0.1%) after a rebound to +0.4% in December; year on year, it accelerated to +1.5% after +1.2% in the previous month.
Acceleration in energy prices year on year
The increase in energy prices was accentuated in January 2018 (+5.2% year on year after +5.0%), mainly due to a rise in energy taxation. Thus, town gas prices (+4.4% year on year after +2.6%) and to a lesser extent electricity prices (+1.7% year on year after +1.5%) accelerated. On the other hand, the prices of petroleum products slowed down year on year (+7.9% after +8.2%): over a month, and despite a more pronounced increase in taxation, prices were less dynamic than in January 2017 (+7.1% vs. +7.5%).
tableauTable1 – Detailed figures for various groups
| Items | Weight | Index | Percentage change | |
|---|---|---|---|---|
| 2018 | Jan. 2018 | m-on-m change(2) | y-on-y change(3) | |
| a) All households | ||||
| Overall | 10000 | 101.75 | −0.1 | 1.3 |
| Overall SA* | 10000 | 102.47 | 0.7 | 1.4 |
| Food | 1627 | 102.43 | 0.3 | 1.2 |
| Fresh food | 243 | 109.51 | 1.9 | 1.8 |
| Other food | 1384 | 101.30 | 0.0 | 1.1 |
| Tobacco | 193 | 105.97 | −0.2 | 5.8 |
| Manufactured products | 2594 | 97.52 | −2.2 | 0.0 |
| Clothing and footwear | 416 | 92.61 | −12.0 | 0.4 |
| Medical products | 425 | 93.89 | −0.4 | −2.1 |
| Other manufactured products | 1753 | 99.47 | −0.4 | 0.3 |
| Energy | 777 | 110.26 | 4.7 | 5.2 |
| Petroleum products | 408 | 115.58 | 7.1 | 7.9 |
| Services | 4809 | 102.38 | 0.2 | 1.3 |
| Actual rentals and services for dwellings | 764 | 101.47 | 0.1 | 0.6 |
| Health services | 617 | 102.41 | 0.0 | 2.0 |
| Transport | 282 | 97.19 | −4.7 | −0.2 |
| Communication | 223 | 98.72 | 0.4 | −0.2 |
| Other services | 2923 | 103.41 | 0.7 | 1.6 |
| Total except rents and tobacco | 9192 | 101.74 | −0.1 | 1.3 |
| Total except tobacco | 9807 | 101.67 | −0.1 | 1.3 |
| b) Urban working-class households or households of employees | ||||
| All products excluding tobacco | 9706 | 101.50 | −0.1 | 1.2 |
| c) Households that belong to the lowest equivalized disposable income quintile - France | ||||
| All products excluding tobacco | 9700 | 101.35 | −0.2 | 1.2 |
- (1) seasonally adjusted
- (2) [m/(m-1)]
- (3) [m/(m-12)]
- Geographical coverage: France excluding Mayotte
- Source: INSEE - Consumer Price Indices
Rise of services inflation
Year on year, prices for services rose by 1.3% after +1.0% in the previous four months. The acceleration was partly due to a seasonal raise of many tariffs: postal services (+6.6% year on year), financial services (+1.6%). In addition, the prices of packages holydays (+12.1% year on year after −6.0%) and accommodation services (+4.9% after +2.0%) accelerated significantly, due to the shift of school holidays. On the other hand, prices for health services slowed down (+2.0% after +2.2% year on year). Transport prices fell back for the first time since October 2016 (−0.2% year on year after +1.1%) in the wake of air transport prices (−3.3% after +0.4%).
Stabibility in prices of manufactured products
Year on year, manufactured product prices were unchanged in January 2018, whereas they had been falling steadily since January 2013. This stability was explained by a rise in clothing and footwear prices (+0.4% year on year after −-0.1%), footwear prices falling significantly less than last year (-11,1% over the month against -13.5% in January 2017). In contrast, medical product prices fell again in January (−2.1% after −1.8%). The prices of “other manufactured products” increased by 0.3% year on year, as in December. Prices for furniture and furnishings (+0.7% after +0.2%) accelerated and the decline in prices of major appliances (−1.8% after −2.8%) was attenuated, the magnitude of winter sales being smaller than last year. On the other hand, new car prices slowed down (+1.5% after +2.6%) and those of information-processing equipment fell further (−4.3% after −3.9%).
Lower inflation in food
In January 2018, food prices rose by 1.2% year on year, after +1.3% in December. Prices for fresh product decelerated (+1.8% year on year, after +2.6%), in line with a slowdown in vegetable prices (+1.4% after +3.3%) and a decline in fresh fish prices (−1.0% after +0.0% in December). Excluding fresh product, year-on-year food prices were up by 1.1%, as in the previous three months. The prices of oils and fats rose at the same rate as in December (+7.4% year on year): over the month, they fell by 0.1% (as in January 2017) after sharp increases throughout of the year 2017.
graphiqueGraph1 – Consumer Price Index (CPI), core inflation (ISJ) (1) and Harmonised Index of Consumer Prices (HICP) (2) year-on-year changes
tableauTable2 – Detailed figures for Core inflation (1) and HICP (2)
| Items | Weight | Index | Percentage change | |
|---|---|---|---|---|
| 2018 | Jan. 2018 | m-on-m(3) change | y-on-y(4) change | |
| Core inflation - All items | 6041 | 101.86 | 0.6 | 0.9 |
| Food excluding fresh products, meat, milk and exotic products | 740 | 101.01 | 0.2 | 0.7 |
| Manufactured products | 2125 | 99.88 | 0.1 | 0.4 |
| Services including actual rentals and services for dwellings | 3176 | 103.01 | 0.6 | 1.3 |
| HICP - All items | 102.06 | −0.1 | 1.5 | |
- (1) Core inflation indicator excludes public sector prices, the most volatile consumer prices and the tax measures. Seasonally adjusted, this index is calculated for all households in France excluding overseas departments and territories. (in French “indice d'inflation sous-jacent - ISJ”)
- (2) HICP: Harmonised Indices of Consumer Prices are inflation figures designed for international comparison between Member states of the European Union. This index is calculated for all households in France excluding Mayotte.
- (3) [m/(m-1)]
- (4) [m/(m-12)]
- Source: INSEE - Consumer Price Indices
Revisions
Compared with the provisional estimates published on January 31, 2018, the month-on-month change in the CPI is confirmed, the year-on-year change is down 0.1points. The month-on-month and year-on-year changes of the HICP are unchanged.
Documentation
Methodology (pdf,141 Ko)
Pour en savoir plus
