


 9 February 2018
2018- n° 34In December 2017, manufacturing output grew sligthly (+0.3%) Industrial production index - December 2017
9 February 2018
2018- n° 34In December 2017, manufacturing output grew sligthly (+0.3%) Industrial production index - December 2017
In December 2017, output grew slightly in the manufacturing industry (+0.3% after −0.8% in November). It increased in the whole industry (+0.5% after −0.3%).
- Manufacturing output increased sharply over the last quarter of 2017 (+2.5%)
- Over a year, manufacturing output grew strongly (+4.9%)
- In December, output recovered in “other manufacturing” (+0.9% after −1.1)
- Output bounced back in machinery and equipment goods (+1.8% after −3.2%)
- Output continued to grow in mining and quarrying; energy; water supply (+1.8% after +3.0%)
- Output went up in the manufacture of coke and refined petroleum products (+0.5% after +2.6%)
- Output slipped back in the manufacture of transport equipment (−2.1% after +3.3%)
- Output decreased again in the manufacture of food products and beverages (−1.2% after −0.7%)

Please note: in accordance with European directives, the industrial production indices will use 2015 as base year from the publication of the indices of January 2018, due on March 9, 2018. From that publication, the industrial production indices will also switch from a fixed base index to an annual chained-linked index.
In December 2017, output grew slightly in the manufacturing industry (+0.3% after −0.8% in November). It increased in the whole industry (+0.5% after −0.3%).
Manufacturing output increased sharply over the last quarter of 2017 (+2.5%)
Output increased sharply over the last quarter of 2017 in the manufacturing industry (+2.5%) as well as in the overall industry (+2.2%).
Output went up markedly in “other manufacturing” (+2.9%), in the manufacture of machinery and equipment goods (+4.1%) and in the manufacture of transport equipment (+2.3%). It increased slightly in mining and quarrying, energy, water supply (+0.2%). Conversely, it decreased in the manufacture of food products and beverages (−0.7%) and in the manufacture of coke and refined petroleum products (−1.0%).
Over a year, manufacturing output grew strongly (+4.9%)
Manufacturing output of the last quarter of 2017 grew strongly compared to the same quarter of 2016 (+4.9%), as well as in the whole industry (+4.2%).
Over a year, output grew strongly in “other manufacturing” (+5.3%), in the manufacture of transport equipment (+8.8%) and in the manufacture of machinery and equipment goods (+6.3%). On the contrary, it diminished in mining and quarrying, energy, water supply (−0.7%) and in the manufacture of food products and beverages (−0.6%). It fell sharply in the manufacture of coke and refined petroleum products (−6.4%).
graphiqueGraphique1a – Monthly Industrial Production Indices
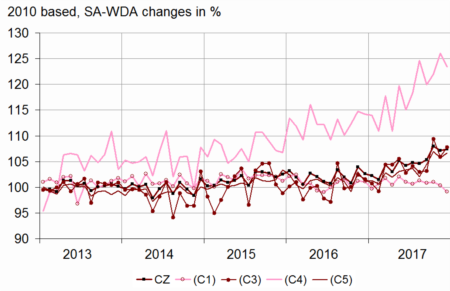
- Legend: CZ: Manufacturing - (C1): Manufacture of food products and beverages - (C3): Machinery and equipment goods - (C4): Manufacture of transport equipment - (C5): Other manufacturing
- Sources: INSEE, SSP, SDES
tableauTableau1a – Variation in the Industrial Production
| NA : A10, (A17) | Dec. / Nov. | Nov. / Oct. | Q-o-Q change (1) | Year-on-year change (2) |
|---|---|---|---|---|
| BE: INDUSTRY | 0.5 | –0.3 | 2.2 | 4.2 |
| CZ: Manufacturing | 0.3 | –0.8 | 2.5 | 4.9 |
| (C1): Manufacture of food products and beverages | –1.2 | –0.7 | –0.7 | –0.6 |
| (C2): Manufacture of coke and refined petroleum products | 0.5 | 2.6 | –1.0 | –6.4 |
| (C3): Machinery and equipment goods | 1.8 | –3.2 | 4.1 | 6.3 |
| (C4): Manufacture of transport equipment | –2.1 | 3.3 | 2.3 | 8.8 |
| (C5): Other manufacturing | 0.9 | –1.1 | 2.9 | 5.3 |
| DE: Mining and quarrying; energy; water supply; waste management | 1.8 | 3.0 | 0.2 | –0.7 |
| FZ: CONSTRUCTION | 4.1 | –0.2 | 1.7 | 3.0 |
- (1) Last three months / previous three months
- (2) Last three months / same three months of previous year
- The codes correspond to the level of aggregation A 10 (A 17) of the “NA” aggregated classification based on the French classification of activities NAF rev.2.
- Sources: INSEE, SSP, SDES
tableauTableau2a – Variation in the Industrial Production
| NA: A10, (A17), [A38 or A64] | Dec. 2017 | Dec. / Nov. | Nov. / Oct. | Quarter-on-quarter change |
|---|---|---|---|---|
| BE: INDUSTRY | 106.3 | 0.5 | –0.3 | 2.2 |
| CZ: Manufacturing | 107.4 | 0.3 | –0.8 | 2.5 |
| (C1): Man. of food products and beverages | 99.2 | –1.2 | –0.7 | –0.7 |
| (C2): Man. of coke and refined petroleum products | 87.9 | 0.5 | 2.6 | –1.0 |
| (C3): Machinery and equipment goods | 107.8 | 1.8 | –3.2 | 4.1 |
| [CI] Man. of computer, electronic and optical products | 117.9 | 3.0 | –1.1 | 3.4 |
| [CJ] Man. of electrical equipment | 91.1 | 3.0 | 0.0 | 3.0 |
| [CK] Man. of machinery and equipment n.e.c. (1) | 107.4 | –0.1 | –6.7 | 5.5 |
| (C4): Man. of transport equipment | 123.4 | –2.1 | 3.3 | 2.3 |
| [CL1] Man. of motor vehicles, trailers and semi-trailers | 116.5 | 2.1 | –2.2 | 6.3 |
| [CL2] Man. of other transport equipment | 130.3 | –5.6 | 8.4 | –0.9 |
| (C5): Other manufacturing | 106.7 | 0.9 | –1.1 | 2.9 |
| [CB] Man. of textiles, wearing apparel, leather and related products | 90.6 | –0.5 | 1.8 | 2.8 |
| [CC] Man. of wood and paper products; printing and reproduction of recorded media | 89.8 | 3.1 | –0.5 | 1.7 |
| [CE] Man. of chemicals and chemical products | 125.4 | 0.6 | –4.1 | 1.6 |
| [CF] Man. of basic pharmaceutical products and pharmaceutical preparations | 123.2 | –2.5 | –2.0 | 8.7 |
| [CG] Man. of rubber and plastics products, and other non-metallic mineral products | 105.3 | 0.2 | –1.0 | 2.6 |
| [CH] Man. of basic metals and fabricated metal products, except machinery and equipment | 103.4 | 3.5 | 0.5 | 1.8 |
| [CM] Other manufacturing; repair and installation of machinery and equipment | 101.9 | 0.4 | –1.0 | 2.5 |
| DE: Mining and quarrying; energy; water supply; waste management | 98.9 | 1.8 | 3.0 | 0.2 |
| [BZ] Mining and quarrying | 101.8 | 2.5 | 1.4 | 5.5 |
| [DZ] Electricity, gas, steam and air-conditioning supply | 98.1 | 2.2 | 3.7 | –0.8 |
| [EZ] Water supply; sewerage, waste management and remediation | 102.6 | –2.1 | –1.5 | 4.7 |
| FZ: CONSTRUCTION | 94.0 | 4.1 | –0.2 | 1.7 |
| MIGs (2) | ||||
| Capital goods | 110.7 | –0.5 | –0.7 | 3.4 |
| Intermediate goods | 104.2 | 1.6 | –1.5 | 1.5 |
| Consumer durables | 118.0 | 6.2 | 8.0 | 0.2 |
| Consumer non-durables | 107.1 | –0.7 | –0.8 | 2.8 |
| Energy | 97.6 | 1.6 | 3.0 | –0.2 |
- (1) n.e.c: not elsewhere classifiable
- (2) Main industrial groupings: definition in Commission regulation EC of 14 June 2007
- Sources: INSEE, SSP, SDES
In December, output recovered in “other manufacturing” (+0.9% after −1.1)
Output accelerated in the manufacture of basic metals and fabricated metal products (+3.5%) and in that of wood, paper and printing industries (+3.1%). It rose in “other manufacturing” (+0.4%), in chemicals (+0.6%) and in the manufacture of rubber and plastics products and other non-metallic mineral products (+0.2%). On the contrary, it continued to decline in pharmaceuticals (−2.5%) and slipped back in textiles, wearing apparel, leather and related products (−0.5%).
Output bounced back in machinery and equipment goods (+1.8% after −3.2%)
Output went up sharply in the manufacture of computer, electronic and optical products (+3.0%) and in the manufacture of electrical equipment (+3.0%). It was virtually stable in the manufacture of machinery and equipment n.e.c.
Output continued to grow in mining and quarrying; energy; water supply (+1.8% after +3.0%)
After a sharp rise in November (+3.7%), output went up again in electricity, gas (+2.2%).
Output went up in the manufacture of coke and refined petroleum products (+0.5% after +2.6%)
Output continued to grow in the manufacture of coke and refined petroleum products (+0.5% after +2.6%).
Output slipped back in the manufacture of transport equipment (−2.1% after +3.3%)
Output fell back sharply in the manufacture of other transport equipment (−5.6% after +8.4%). By contrast, it bounced back in the manufacture of motor vehicles, trailers and semi-trailers (+2.1% after −2.2%).
Output decreased again in the manufacture of food products and beverages (−1.2% after −0.7%)
Output decreased in the manufacture of food products and beverages (−1.2% after −0.7%), due, in particular, to a drop in the manufacture of beverages.
tableauTableau3a – Revision of variations
| Nov. / Oct. | Oct. / Sept. | Sept. / Aug. | Q3 2017 / Q2 2017 | 2016 / 2015 | |
|---|---|---|---|---|---|
| Industry (BE) | 0.14 | –0.01 | 0.07 | 0.02 | 0.00 |
| raw serie | 0.05 | –0.06 | 0.05 | –0.01 | 0.00 |
| SA-WDA parameters | 0.09 | 0.05 | 0.02 | 0.03 | 0.00 |
| Manufacturing (CZ) | 0.19 | –0.04 | 0.10 | 0.01 | 0.00 |
| raw serie | 0.06 | –0.06 | 0.05 | –0.02 | 0.00 |
| SA-WDA parameters | 0.13 | 0.02 | 0.05 | 0.03 | 0.00 |
- How to read it: in the manufacturing sector, the SA-WDA variation between October 2017 and November 2017 is revised by +0.19 points, +0.06 points are due to the revision of the raw series and +0.13 points to the updating of the SA-WDA parameters.
- Sources: INSEE, SSP, SDES
Documentation
Methodology (pdf,163 Ko)
Pour en savoir plus
