


 18 January 2018
2018- n° 11In December, the increase in oil prices lessened Prices of oil and raw material imports - December 2017
18 January 2018
2018- n° 11In December, the increase in oil prices lessened Prices of oil and raw material imports - December 2017
In December 2017, the price of crude oil in euros eased (+1.8% during the month, after +9.0% in November). The prices in euros of all other imported commodities decreased (−0.7% after +1.0%). As a matter of fact, the prices of raw food materials fell back (−3.2% after +0.1%) and those of industrial raw materials increased again (+1.8% after +2.0%).

Warning: the imported raw materials index has been upgraded. The basket of goods has been expanded, weights re-estimated, and the index has been rebased in 2010. For further details, please refer to the methodology note.
In December 2017, the price of crude oil in euros eased (+1.8% during the month, after +9.0% in November). The prices in euros of all other imported commodities decreased (−0.7% after +1.0%). As a matter of fact, the prices of raw food materials fell back (−3.2% after +0.1%) and those of industrial raw materials increased again (+1.8% after +2.0%).
Oil price eased
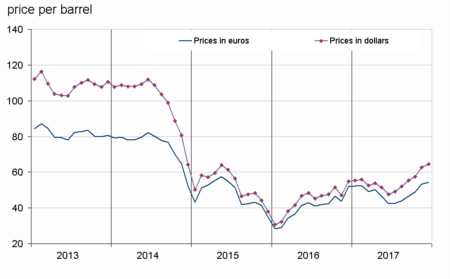
In December 2017, the price of North Sea crude oil (Brent) in euros slowed down (+1.8% after +9.0% in August) to an average of €54 per barrel. In dollars, the rise was more marked in December (+2.7% after +8.9%), because the euro slightly appreciated during the month.
graphiqueGraph1 – Oil (Brent)
- Source: INSEE
tableauTable1 – Oil and petroleum products
| Prices | Change (%) | |||
|---|---|---|---|---|
| of last month | over the last month | over the last 3 months | over the last 12 months | |
| Brent in $ per barrel | 64.4 | 2.7 | 16.1 | 17.2 |
| Brent in € per barrel | 54.4 | 1.8 | 16.8 | 4.3 |
| Gasoline cts €/L | 39.1 | –5.1 | –5.0 | –4.4 |
| Gas Oil | 481.4 | 0.9 | 7.9 | 4.8 |
| Heavy fuel | 319.8 | –0.9 | 10.5 | 1.6 |
| Naphtha | 483.4 | –0.9 | 15.5 | 10.5 |
- Prices are in euros per tonne unless otherwise specified
- Source : INSEE
Food commodity prices fell back
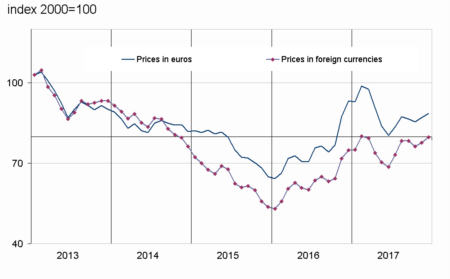
In euros, the prices of raw food materials fell back (−3.2% after +0.1%). The price of sugar plummeted (−4.5% after +5.4%). The prices of cereals slipped back (−0.7% after +0.1%) as those of oil seeds and vegetable oils fell back even more (−2.5% after +0.7%), because of palm oil prices suffering from weak demand and high stock levels. The prices of seafood products kept decreasing (−6.2% after −3.3%) as well as those of tropical foodstuffs (−6.2% after −1.7%). The price of all meats slowed down (+1.8 % after +5.2%).
graphiqueGraph3 – Food
- Source: INSEE
Industrial commodity prices increased again
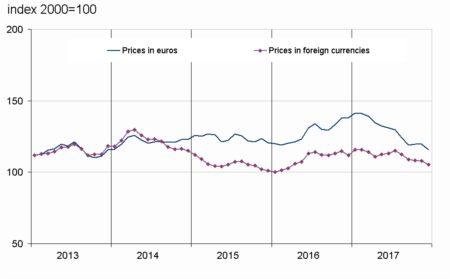
In December 2017, the prices in euros of industrial raw materials increased again (+1.8% after +2.0%). The prices of minerals ramped up (+2.3% after +1.3%), largely due to rising prices in ferrous metals (+11.3% after +4.1%). The prices of precious metals slipped back (−3.2% after +0.9%) because of the decrease in silver prices (−5.8% after +0.6%). The prices of non-ferrous metals kept falling back (−2.1% after −0.2%). The prices of agro-industrial raw materials were virtually stable (−0.1% after +5.0%). Those of natural fibres increased again (+3.9% after +3.4%), as those of hides (+3.9% after +0.9%) and those of tropical wood (+0.5% after +0.3%). The price of natural rubber recovered (+1.3% after −1.7%) whereas wood pulp prices slowed down (+2.8% after +4.5%). Only the price of sawn softwood plummeted (−6.1% after +9.3%).
tableauTable2 – Imported raw materials (excluding energy) in euros
| Index | Changes (%) | |||
|---|---|---|---|---|
| of last month | over the last month | over the last 3 months | over the last 12 months | |
| Food total | 115.8 | –3.2 | –2.7 | –16.1 |
| Tropical foodstuffs | 91.5 | –6.2 | –7.3 | –22.4 |
| Oil seeds, vegetable oils | 109.8 | –2.5 | –0.9 | –12.8 |
| Cereals | 89.6 | –0.7 | –0.4 | –7.1 |
| Sugar | 72.7 | –4.5 | 4.2 | –33.4 |
| Meat | 145.9 | 1.8 | 4.4 | –3.1 |
| Seafood products | 112.6 | –6.2 | –7.6 | –22.7 |
| Industrial raw materials | 88.7 | 1.8 | 2.4 | –4.9 |
| Agricultural raw materials | 115.7 | –0.1 | 8.5 | 3.0 |
| Natural Fibres | 97.7 | 3.9 | 6.6 | –1.4 |
| Natural rubber | 48.5 | 1.3 | –8.5 | –32.6 |
| Hides | 80.6 | 3.9 | 5.5 | –24.3 |
| Wood pulp | 119.4 | 2.8 | 11.1 | 9.4 |
| Tropical wood | 96.3 | 0.5 | 1.4 | –4.4 |
| Sawn softwood | 202.5 | –6.1 | 12.1 | 28.5 |
| Minerals | 83.3 | 2.3 | 1.1 | –6.4 |
| Ferrous metals | 57.1 | 11.3 | 1.5 | –19.2 |
| Non-ferrous metals | 104.8 | –2.1 | 1.2 | 5.1 |
| Precious metals | 104.5 | –3.2 | –3.4 | –3.9 |
| All commodities | 100.9 | –0.7 | –0.1 | –10.9 |
- Source: INSEE
graphiqueGraph2 – Imported raw materials (excluding energy)

- Source: INSEE
graphiqueGraph4 – Industrial raw materials
- Source: INSEE
Pour en savoir plus
Time series : Raw materials prices
