


 29 December 2017
2017- n° 350In November 2017, agricultural prices rose by 0.3% over one year Indices of agricultural prices - November 2017
29 December 2017
2017- n° 350In November 2017, agricultural prices rose by 0.3% over one year Indices of agricultural prices - November 2017
In November 2017, agricultural products prices increased by 0.3% over one year (after +0.5%). Excluding fruits and vegetables, they went up 1.2% over one year and 1.4% over one month.

Information : in accordance with the European directives, index of producer prices of agricultural products and indices of purchase prices of the means of agricultural production will be disseminated in reference year 2015=100 from March 6th 2018, release date of January 2018 results.
In November 2017, agricultural products prices increased by 0.3% over one year (after +0.5%). Excluding fruits and vegetables, they went up 1.2% over one year and 1.4% over one month.
Steady prices for cereals, increase in oilseeds
In November 2017, cereals prices were stable over a month. Soft wheat prices fell 0.2% after +0.4% in October. Dynamic demand from the Maghreb absorbs abundant supply. Grain maize prices gained 1.8% over one month as Ukrainian yields were below expectations. After three months of decline, oilseeds prices rebounded (+2.5%). The prices of rapeseed (+2.4%), sunflower (+2.8%) and soya (+1.8%) were sharply up, in the wake of oil prices.
graphiqueGraph1 – Producer prices of cereals
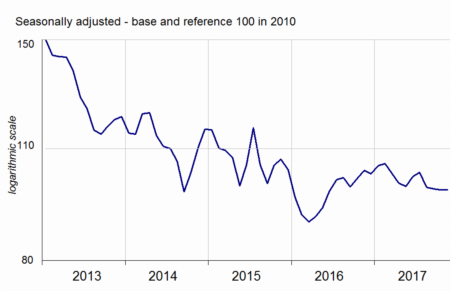
- Source: INSEE
Fresh vegetables prices droped over a year
In November 2017, fresh vegetables prices decreased by 19.7% due to the fall in seasonal produce prices (endives and cauliflowers). Demand has not kept pace with the seasonal rise in supply. Fresh fruit prices rose by 7.3% over a year; especially kiwifruit (+36.4%), grapes (+22.3%) and clementines prices (+8.1%).
graphiqueGraph2 – Producer prices of fresh vegetables
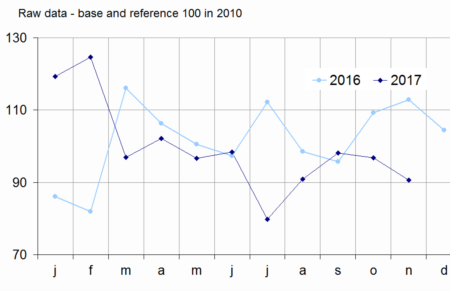
- Source: SSP (ministry in charge of agriculture)
Rise in animal prices
Animal prices rose by 0.9% in November 2017. Adjusted for seasonal variations, pig prices are up over one month (+2.9%) for the first time since April 2017. Over one year, they declined by 8.2%. After three months of increases, cattle prices were almost stable in November (-0.1%). They have grown by 6.7% over one year.
graphiqueGraph3 – Producer prices of pigs and large cattle
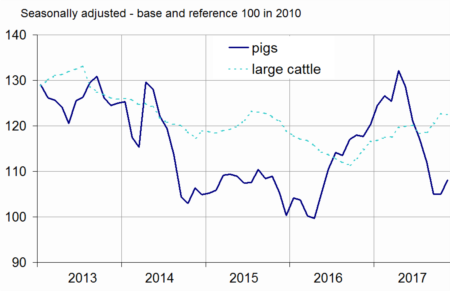
- Source: INSEE
Egg prices soared again
In November 2017, egg prices rose sharply (+22.0%) for the third month in a row. French origin was still very much in demand after the crisis of fipronil. The price of cow's milk partly benefited from the spike of butter prices : it increased by 15.4% over one year in October.
tableautable1 – Index of producer prices of agricultural products (IPPAP)
| Variation as % over | |||||
|---|---|---|---|---|---|
| Weights | Nov 2017 | a month | 3 months | a year | |
| Agricultural goods output | 1000 | 117.4 | /// | /// | +0.3 |
| excluding fruits and vegetables | 900 | 118.5 | +1.4 | +1.9 | +1.2 |
| Crop output (excluding fruits and vegetables) | 505 | 117.7 | +0.9 | –1.4 | –4.2 |
| Cereals | 188 | 97.8 | 0.0 | –0.7 | –5.4 |
| of which soft wheat | 112 | 94.9 | –0.2 | –0.3 | –5.7 |
| grain maize | 41 | 91.7 | +1.8 | –0.2 | –8.7 |
| Potatoes | 26 | 169.5 | /// | /// | –30.7 |
| Wines | 177 | 140.0 | +1.5 | +5.1 | +3.5 |
| protected designation of origin | 84 | 156.7 | +1.7 | +7.1 | +6.5 |
| other wines | 23 | 138.5 | +4.7 | +8.2 | –0.9 |
| Oleaginous | 49 | 96.6 | +2.5 | +0.6 | –8.1 |
| Horticultural products | 30 | 111.2 | –0.1 | +0.9 | +0.4 |
| Other crop products | 36 | 108.4 | –0.5 | –1.3 | 0.0 |
| Fruits and vegetables (1) | 100 | 107.4 | /// | /// | –7.3 |
| Fresh vegetables | 53 | 90.7 | /// | /// | –19.7 |
| Fresh fruits | 35 | 131.5 | /// | /// | +7.3 |
| Animal output | 395 | 119.4 | +2.0 | +6.3 | +8.5 |
| Animals | 234 | 114.6 | +0.9 | +1.3 | +1.3 |
| of which large cattle | 96 | 122.5 | –0.1 | +3.3 | +6.7 |
| calves | 26 | 108.7 | +3.0 | +10.0 | +4.1 |
| pigs | 54 | 108.0 | +2.9 | –3.6 | –8.2 |
| sheep | 10 | 118.5 | +1.1 | –2.9 | +1.3 |
| poultry | 46 | 108.7 | –0.2 | –0.4 | –0.2 |
| of which chicken | 28 | 108.6 | –0.2 | –0.4 | –0.1 |
| Milk | 147 | 113.5 | /// | +3.5 | +12.5 |
| of which cow milk (2) | 137 | 113.2 | /// | +3.4 | +13.1 |
| Eggs | 15 | 256.0 | +22.0 | +102.1 | +69.2 |
- * cf. methodological note
- /// Absence of meaning due to the nature of these series
- (1) Including vegetables for industry.
- (2) The October value of cow milk price index has been carried forward in November. The previous month variation is the one commented in the text : +15.4% over one year in October 2017.
- Sources: INSEE, SSP (ministry in charge of agriculture)
Increase in purchase prices of means of production
Intermediate consumption prices rose moderately in November 2017 again (+0.3% as in October). Over a year, they increased by 1.4%. Energy prices accelerated: +3.0% in November after +1.7% in October. They gained 10.7% over a year. Fertilizers and amendments prices went up by 0.9% over one month while animal feeds prices decreased by 0.5%. Capital goods prices were stable in November and grown by 2.1% over one year.
Revision
The variation over one year of IPPAP has been rosen by 0.2 points in October 2017 to +0.5%; that of IPAMPA has been rosen by 0.1 point at +1.3%.
graphiqueGraph4 – Purchase prices of the means of agricultural production
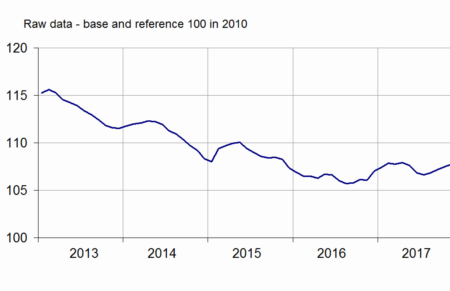
- Sources: INSEE, SSP (ministry in charge of agriculture)
tableautable2 – Indices of purchase prices of the means of agricultural production (IPAMPA)
| Variation as % over | |||||
|---|---|---|---|---|---|
| Weights | Nov 2017 | a month | 3 months | a year | |
| Total input | 1000 | 107.7 | +0.2 | +0.8 | +1.5 |
| Intermediate consumptions | 764 | 107.0 | +0.3 | +0.9 | +1.4 |
| Energy | 100 | 104.5 | +3.0 | +8.0 | +10.7 |
| Seeds | 57 | 106.1 | 0.0 | –0.1 | –1.0 |
| Fertilisers and soil improvers | 92 | 101.7 | +0.9 | +4.5 | +3.8 |
| Plant protection products | 78 | 97.7 | –0.4 | –0.2 | –1.3 |
| Animal feed | 205 | 110.7 | –0.5 | –1.8 | –1.2 |
| Veterinary expenses | 43 | 120.0 | –0.2 | +0.3 | +1.1 |
| Small equipment and tools | 17 | 107.8 | +1.0 | –0.2 | –0.7 |
| Maintenance of materials | 67 | 116.1 | +0.1 | +0.2 | +2.1 |
| Maintenance of buildings | 9 | 109.2 | 0.0 | 0.0 | +1.8 |
| Other goods and services | 97 | 102.1 | 0.0 | –0.1 | –0.1 |
| Goods and services contributing to investment | 236 | 110.2 | 0.0 | +0.6 | +2.1 |
| Material | 186 | 111.4 | +0.1 | +0.8 | +1.8 |
| Tractors | 79 | 114.4 | –0.2 | +1.6 | +4.0 |
| Machinery and equipment for cultivation | 36 | 112.0 | 0.0 | +0.2 | +1.2 |
| Machinery and equipment for harvesting | 42 | 109.9 | +0.2 | +0.5 | +0.1 |
| Utility vehicles | 18 | 104.0 | +0.2 | –0.8 | –1.0 |
| Buildings | 50 | 105.8 | 0.0 | 0.0 | +3.2 |
- (1) The repayment of the domestic tax on energy product (TICPE) benefiting farmers has been applied in advance for the year 2017.
- Sources: INSEE, SSP (ministry in charge of agriculture)
Documentation
Methodology (pdf,122 Ko)
Pour en savoir plus
Time series : Indices of agricultural prices
