


 21 December 2017
2017- n° 336In December 2017, the business climate in manufacturing remains very favourable Monthly business survey (goods-producing industries) - December 2017
21 December 2017
2017- n° 336In December 2017, the business climate in manufacturing remains very favourable Monthly business survey (goods-producing industries) - December 2017
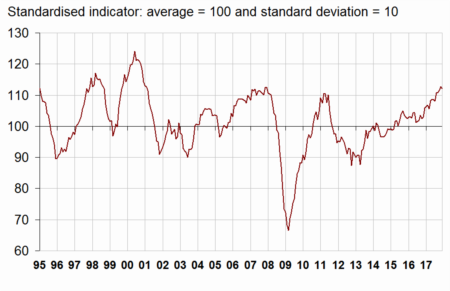
According to the business managers surveyed in December 2017, the business climate in industry remains very favourable, although the composite indicator has gone down by one point after hitting a ten-year high in November. At 112, it remains well above its long-term average (100).
- The balance of opinion on past activity has faltered
- In the food and beverage production industry, the business climate indicator has inched down
- The business climate is stable in the manufacture of machinery and equipment goods
- The business climate has reached a peak since mid-2001 in the manufacture of transport equipment
- The business climate is slightly less favourable in “other manufacturing industries”
According to the business managers surveyed in December 2017, the business climate in industry remains very favourable, although the composite indicator has gone down by one point after hitting a ten-year high in November. At 112, it remains well above its long-term average (100).
graphiqueGraph 1 – Business climate in manufacturing - Composite indicator
The turning-point indicator remains in the zone indicating a favourable economic outlook.
graphiqueGraph 2 – Turning-point indicator
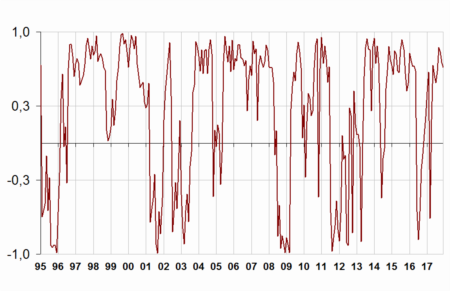
- How to read it: close to 1, the indicator points to a favourable short-term economic situation (-1 is unfavourable). The uncertainty area is between −0.3 and +0.3.
The balance of opinion on past activity has faltered
After a significant rise in November, the balance of opinion on past activity has weakened in December yet remains significantly above average. The balance on general production prospects for the sector has edged down after reaching last month a level unseen since August 2000.
However, manufacturers are as optimistic about their personal production expectations as in November. The corresponding balance remains well above its mean.
After reaching its highest point since March 2008, the balance on global order books has slightly dipped in December, although still well above average. That on export order books has slightly increased and reached its highest level since February 2008.
Lastly, fewer industrialists consider that their finished-goods inventories are above normal. The corresponding balance remains below its long-term average.
tableauTable 1 – Industrialists' opinion on manufacturing activity
| Manufacturing industry | Ave.* | Sept. 17 | Oct. 17 | Nov. 17 | Dec. 17 |
|---|---|---|---|---|---|
| Composite indicator | 100 | 111 | 111 | 113 | 112 |
| Past activity | 5 | 12 | 16 | 26 | 21 |
| Finished-goods inventory | 13 | 3 | 5 | 7 | 4 |
| Overall order books | –18 | 0 | 0 | 1 | –1 |
| Export order books | –14 | 1 | 1 | 0 | 2 |
| Personal production expectations | 5 | 20 | 17 | 15 | 15 |
| General production expectations | –8 | 23 | 30 | 31 | 30 |
- * Long-term average since 1976.
- Source: INSEE - Monthly business tendency survey in industry
The business climate in manufacturing in November 2017 has been raised from 112 to 113 since its first estimation, mainly due to the inclusion of late responses from businesses.
In the food and beverage production industry, the business climate indicator has inched down
In the manufacture of food products and beverages, the business climate has inched down by one point in December. At 112, it stands well above its long-term average. This slight shift mainly comes from a fall in the balances of opinion on past activity and on overall order books.
The business climate is stable in the manufacture of machinery and equipment goods
In the overall manufacture of machinery and equipment goods, the business climate is stable at 111, significantly above its long-term mean. In particular, the balance on past activity has risen, whereas that on personal production expectations has decreased.
The business climate has improved in electrical equipment while remaining unchanged in machinery and equipment and in the computer, electronic and optical product industry.
The business climate has reached a peak since mid-2001 in the manufacture of transport equipment
In the manufacture of transport equipment, the business climate has improved by two points, to 111, reaching its highest level since June 2001. This increase is primarily driven by the rise in the balance on global order books.
The business climate has further improved in the manufacture of motor vehicles, trailers and semi-trailers while it is stable in other transport equipment.
The business climate is slightly less favourable in “other manufacturing industries”
In overall “other manufacturing”, the business climate has fallen by two points, back to its October level after peaking in November at its highest level since April 2007. This downturn is due to fall in all the balances apart from that on export order books.
In particular, the business climate indicator has declined again in “other manufacturing industries” and has fallen back in basic metals, clothing-textiles, and rubber and plastic products, while remaining above its mean in the four sectors. In contrast, it has brightened in chemicals and wood-paper.
graphiqueGraph 3 – Business climates in a sector-based approach
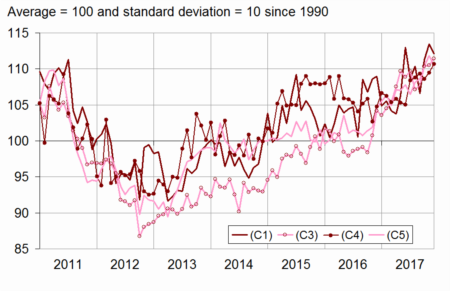
- Legend: (C1): Manufacture of food products and beverages - (C3): Machinery and equipment goods - (C4): Manufacture of transport equipment - (C5): Other manufacturing
tableauTable 2 – Business climates in a sector-based approach
| NA* : (A17) et [A38 et A64] | Weights** (%) | Oct. 17 | Nov. 17 | Dec. 17 |
|---|---|---|---|---|
| (C1) Man. of food products and beverages | 22 | 111 | 113 | 112 |
| (C3) Machinery and equipment goods | 11 | 110 | 111 | 111 |
| [CI] Computer, electronic and optical products | 3 | 113 | 111 | 111 |
| [CJ] Electrical equipment | 3 | 106 | 109 | 113 |
| [CK] Machinery and equipment | 5 | 109 | 108 | 108 |
| (C4) Man. of transport equipment | 15 | 109 | 109 | 111 |
| [CL1] Motor vehicles, trailers and semi-trailers | 7 | 112 | 113 | 115 |
| [CL2] Other transport equipment | 8 | 104 | 103 | 103 |
| (C5) Other manufacturing | 46 | 110 | 112 | 110 |
| [CB] Textiles, clothing industries, leather and footwear industry | 2 | 107 | 112 | 110 |
| [CC] Wood, paper, printing | 5 | 110 | 113 | 117 |
| [CE] Chemicals and chemical products | 9 | 107 | 105 | 107 |
| [CG] Rubber and plastic products | 7 | 114 | 119 | 114 |
| [CH] Basic metals and fabricated metal products | 11 | 109 | 111 | 106 |
| [CM] Other manufacturing industries | 9 | 110 | 108 | 107 |
- * NA: aggregated classification, based on the French classification of activities NAF rév.2.
- ** Weights used to aggregate sub-sector's balances of opinion.
- Source: INSEE - Monthly business tendency survey in industry
Documentation
Methodology (pdf,133 Ko)
Pour en savoir plus
Time series : Industry - Activity and demand
